


Commodities Update – Mid-Year Review Gold, Silver, Copper, Uranium
Excelsior Prosperity w/ Shad Marquitz 07/04/2025
Overall, the first half of 2025 was very bullish action across most commodities, and in particular the metals. It was quite constructive to see gold, silver, and the precious metals stocks outperforming most other sectors in the broad markets in Q1.
Then, after the early April sell-off across the board in markets, due to the tariff tantrums, we saw a V-shaped recovery in most sectors in the second quarter of this year. It is interesting to note that it was the base metals and energy metals that started to shine more in Q2, along with a catchup trade in the resource stocks.
Silver caught a bigger bid and officially broke out above the $35 resistance on it’s 3rd attempt. As previously predicted, this time it looks like it has a better chance of sticking (3 times a charm).
Copper rallied back above $5 again for the 3rd time, (also 3 times a charm)
Platinum surged higher to levels not seen in 13 years, surprising both bulls and bears alike. {I’ll have an article dedicated to the PGMs and ways to play it soon}
Aluminum rebounded off it’s April lows to higher prices than where it was trading before Liberation Day
Uranium and uranium stocks started their trek higher again into the next uptrend, boosted by a bevy of positive newsflow.
Oil and Nat Gas were on a volatile rollercoaster ride, due to macroeconomics and conflicting supply/demand fundamentals, and then intersecting geopolitical tailwinds and headwinds. {More on that in a later article to come}.
From a big picture perspective, it does seem like we’ve seen a reflationary trade coming out of the early April US tariff policy concerns, and even the general stock markets and cryptocurrencies have rallied to new highs in tandem with the commodities sector in Q2. The narratives from just a few months ago, that the world was coming to an end and the financial skies were falling, were quickly reversed with breakouts in so many asset classes, ever since the April 9th pausing of the tariffs through the end of the quarter.
Obviously, we don’t know what is in store for next week when the reciprocal tariff pauses come off on July 9th, but when reviewing the first half of this year through the lens of commodities and resource stock investing, it was a very bullish time period where many investors saw a lot of green on the screen in their trading accounts.
As a personal anecdote: The months of May and June were the first times where literally all my trading positions were uniformly in the green and in the profit zone, (something I’d not seen since the first half of 2021, which was another bullish period in the commodities). In speaking with other investors, it would seem many of them saw their trading accounts at all-time highs to close off the first half of 2025; and I also had that same experience. The overall 6-month change in my diversified trading account of resource stocks is up (79.3%) so far this year; and that is coming off the back of a very constructive year in 2024 in many commodities.
It's a good time of year, here in the calm of the 4th of July USA Independence Day holiday, and slower pace of the warm days of early Summer, to review some charts and data on the first half of 2025.
So, let’s get into it…
Let’s kick things off, as we often do with a daily chart of Gold:
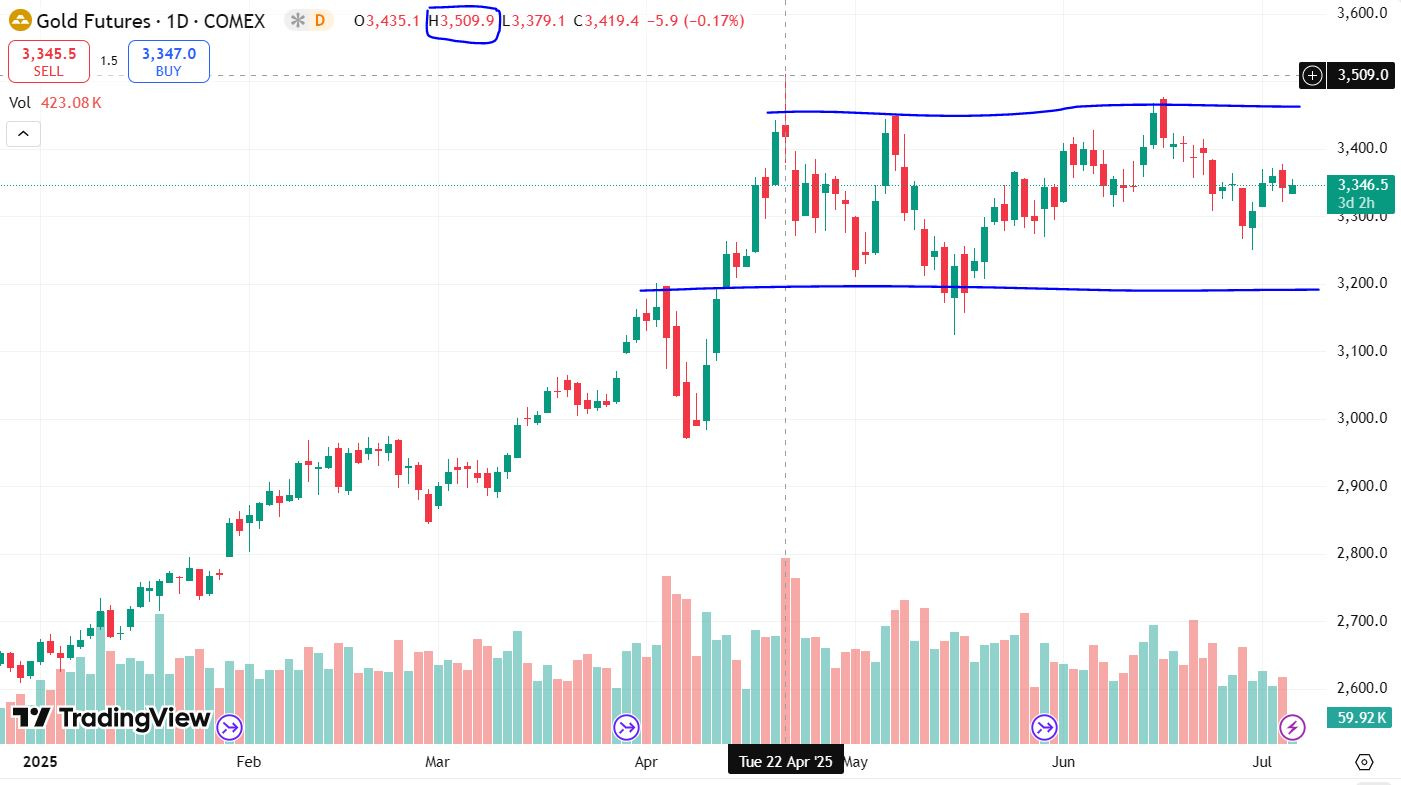
The high-water mark for gold futures of this year and really of all-time was that $3,509.90 level hit on April 22nd, which was in the second quarter.
In fact, Gold put in it’s highest quarterly close on record in Q2 at $3,307. Bullish.
I just quickly hand drew the rough trading range that gold has been in since then of around $3,200 to $3,450. (not perfect but you get the idea)
This is a good example of the gold price consolidating through time, more so than in price. Some technicians will say it is flagging sideways, but that is too long for it just to be a flag, and it is really more of a channel now with a constrained trading range. The point will be the same though; gold is building up the energy for a big move one way or the other.
Now, since gold has been in a steady uptrend since November of 2022, then odds favor a continued bullish breakout to the upside to test that $3,509 peak again; and possibly a move upwards towards that round psychological $4,000 level.
If we get some kind of crazy news and reaction next week on the back of the reciprocal tariffs coming off that pummel the markets again, then a move all the way back down to $3,000 or even $2,900 support zones would not be the end of the bull market. Personally, I’m not anticipating it to be that deep, but we should still be prepared for how we would react to any potential scenario on the horizon.
Personally, I’ve got the most cash built up in my trading account than I’ve had in years, after trimming back some PM winners just a little bit the last 2 months, to be able to capitalize on any market corrections; even though the probabilities are for gold to break out of this channel in a bullish move.
As a quick aside: It’s odd that many herd traders build up the most cash at bottoms when they are max fearful, and that is actually the time to be deploying all that cash and get more fully deployed. In contrast, when all markets are at record highs across the board and at max optimism, from commodities, to general equities, to cryptos, that is actually when savvy traders trim their winnings a bit, ringing the register to build up some cash on the sidelines to pounce on potential pullbacks. {not investing advice, and there are tax ramifications, so not tax advice either… just sharing my own personal thesis and experience as an investor for over 2 decades}
It is not lost on me that we saw or heard all these comments over at KE Report or over on Ceo.ca back in September of 2022 that people were “going to their biggest cash positions in years” or “going to mostly cash” after gold initially dropped below $1,675 support down to $1,620, and silver hit $17.40, and the PM stocks nosedived down to bottom out. That means of course that fear caused them to sell at or near the lows — at exactly the wrong time, once again.
I vocally pushed back on some of those “sell everything and move to cash” calls at the time, suggesting that was precisely the kind of nonsense advice we get at market bottoms, and that was actually the time to deploy cash, not go into all cash. Here’s a sample of one of many posts during that “dire” timeframe.
@Excelsior - Sep 24, 2022 - The KE Report:
“I liked Goldfinger’s target of $1625 in Gold as a potential spot where buying could come in, stop the bleeding, and then cause a reversal squeezing the shorts back higher. It was also encouraging the last 2 weeks to see Silver bounce off $17.40, and then springboard back up into the mid-$19s again.”
“There is a lot of bearishness out there, and sentiment is getting about as bad as it was in 2015 again, so that is actually a contrarian bullish signal. The BPGDM chart going down to a reading of 7 is also a contrarian bullish signal, as the market breadth in the gold stocks is fugly. There are other readings of gold stocks below their 200-day moving averages, or making new 52 week lows that are now so bearish, that they look contrarily bullish.”
“Still, the markets can stay oversold and irrational longer than many can stay solvent, so these conditions could still deteriorate further. The BPGDM could go to 0 and stay there for a month like it did a few years ago, so it isn’t a great timing tool, but at these low levels, it is definitely showing we are closer to at turn than we are a whole leg lower. So while we could still see things sell off further, scaling into positions into this weakness is a solid approach for those that like to catch tradable rallies.”
As we now know, Silver bottomed by mid-September 2022 and started to rally, then the GDX, GDXJ, SIL, and most quality PM stocks bottomed by late September 2022 and started to rally. Gold did a triple-test of the $1,620 area, starting in September and bottoming at $1,618 in November of 2022, then ratcheted aggressively higher in the next couple months tacking on hundreds of dollars. All of those people that went to mostly cash at the exact wrong time were then stuck chasing markets higher… like we see every time…
Fast-forward to today: After seeing gold close up for a really solid first half of 2025, and almost everybody, from PM die-hard stackers, to central banks, to billionaire hedge fund moguls, to even generalist investors and main-stream media outlets - everyone is uniformly bullish on gold… There are hardly any bears remaining.
For the record, I’m still bullish medium-term on gold and gold equities too, and just laid out the case for probabilities favoring gold breaking out of this several-month consolidation channel and heading higher to retest $3,509 and possibly vault up to approach the round psychological level of $4,000. However, I’m not nearly as bullish as I was with that price action we saw in the fall of 2022 getting near a bottom and an expected rally, nor as bullish as I was back when gold put in the new daily/weekly/monthly/quarterly highs in late 2023 signalling that the gold breakout had begun. All I’m suggesting is that when everyone is on the same side of the boat and uniformly bullish, then Mr. Market loves to upset the applecart.
We have no idea what short-term effects the unpausing of the tariffs may cause in the week(s) ahead, to the upside or the downside, or what other geopolitical news or global financial news we have in store (positive or negative) that could be used as narrative to push gold and gold stocks up or down. So I made the personal decision over the last 2 months, to pull well-earned partial profits in a number of gold/silver stocks and tuck some of those funds away for a rainy day… especially when we’ve seen a melt-up in most markets since April 9th, and most markets are up near 52-week highs or all-time highs. If things go well for the PMs, then I can use those funds to add more to oil/gas stocks, but if things go south, then I’m prepared. The trims made to portfolio stocks were also only 10%-15% of positions that were already up multi-fold. As should be obvious, you don’t really have gains if you never take them.
My sincere hope is that gold and silver and PM stocks keep ripping higher and higher, and I’ve got PLENTY of sector exposure if that is what plays out… but hope is not a strategy. In trading, the time to sellback partial positions in winners to generate cash is not during fearful selloffs during a bottoming process, but rather, during the most optimistic times, when everyone feels good, and we are hearing the most optimistic forecasts. Just some food for thought…because that is precisely where we are at.
Now, let’s check in on the technical trends in the larger gold producers in the GDX:
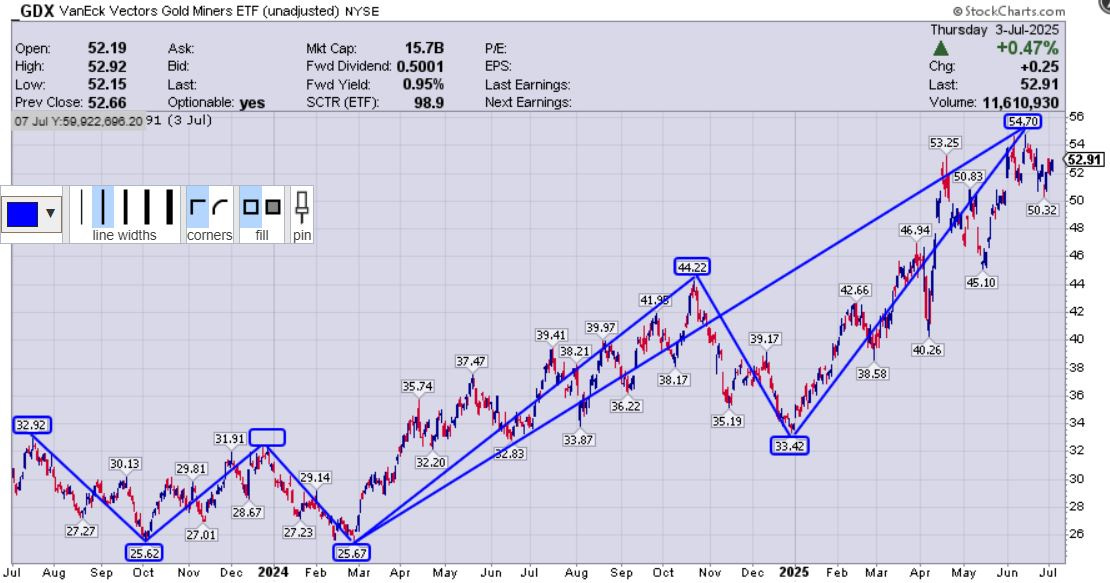
We see the W-shaped double-bottom in GDX at the end of 2023 and early 2024 bottoming at $25.62 and $25.67 respectively. This was the worm turning in the sector.
The GDX has more than doubled since that 2024 leap-day low of $25.67 up to the recent June peak of $54.70.
The GDX is up 63.7% off the low of $33.42 in very late 2024 coming into this year
The senior gold producers held in this ETF have done very well as a group, both last year and so far this year.
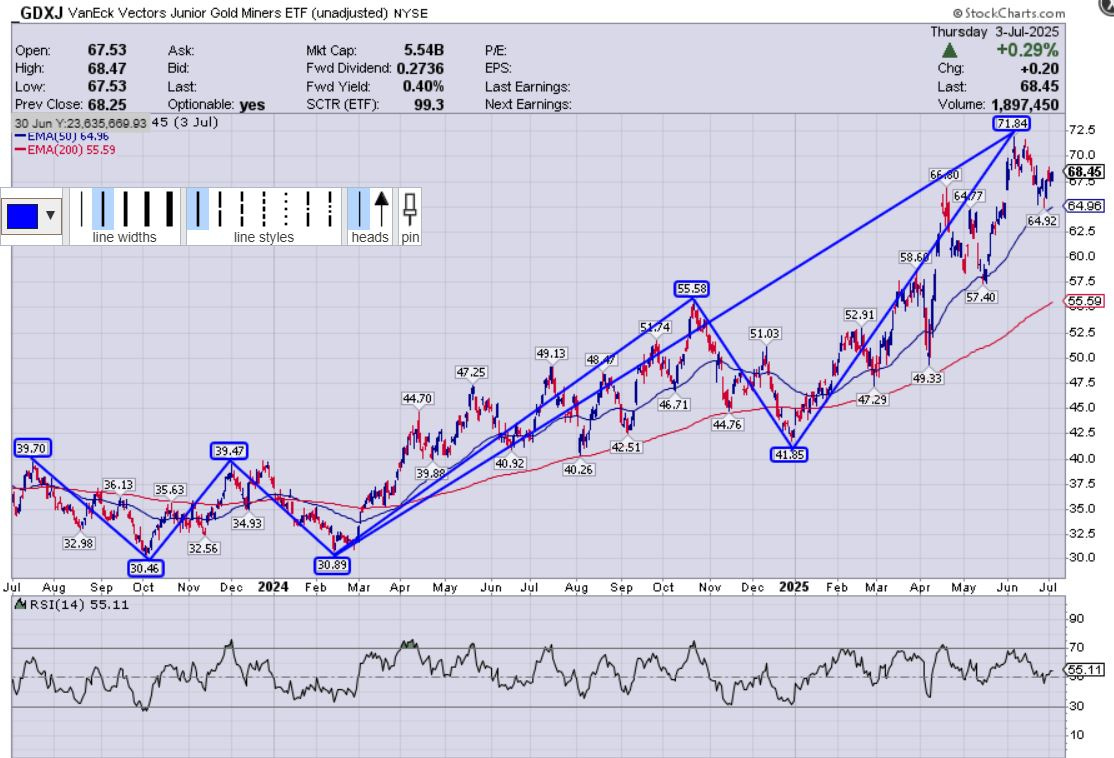
The GDXJ chart has a very similar look and trend to the GDX chart.
(GDXJ) remains bullishly above both the 200-day and 50-day EMAs.
RSI is in neutral territory with a Friday reading of 55.11
Silver really amped things up in the 2nd quarter and definitively broke out above the long-standing $35 resistance level.
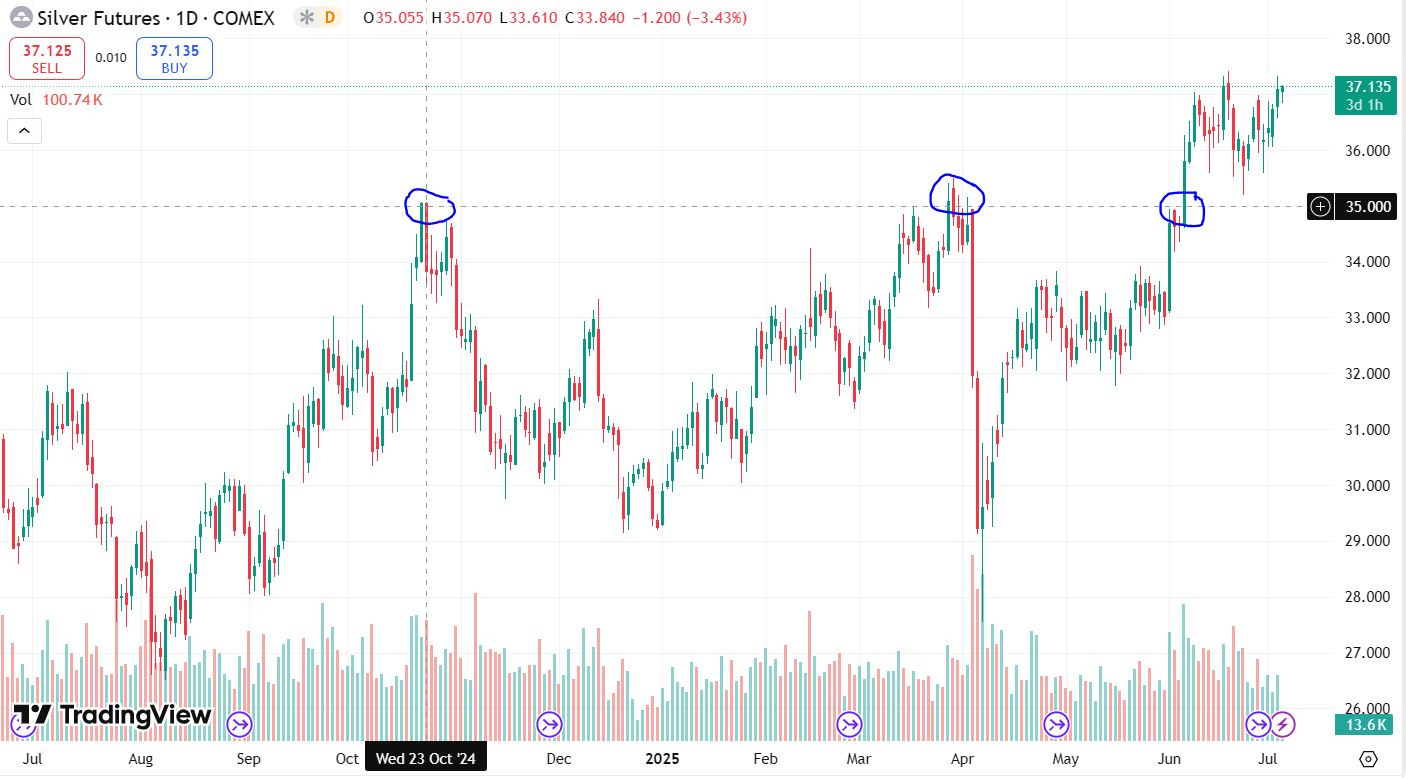
This won’t come as a surprise to readers of this channel, but may come as a surprise to those using Stockcharts (which doesn’t show the correct futures price levels), but Silver first breached $35 back on October 22nd and 23rd 2024, getting up to $35.07 intraday and closing on the 22nd at $35.04, and opening on the 23rd at $35.05.
Then Silver breached $35 again in March of 2025 putting in a close of $35.08, and making it up to around $35.40 in intraday trading.
We postulated previously here in this channel that once silver breached $35 again, for the 3rd time, that it would likely stick and ratchet higher. Well, that is precisely what we just saw play out in June, with silver closing the quarter at $36.10 (the 2nd highest quarterly close on record). That’s a bullish data point for sure.
Silver closed this last week at $37.13, and remains in a strong bullish posture.
The silver stocks are waking up to these increased margins and improved economics as evidenced by the chart of the SIL
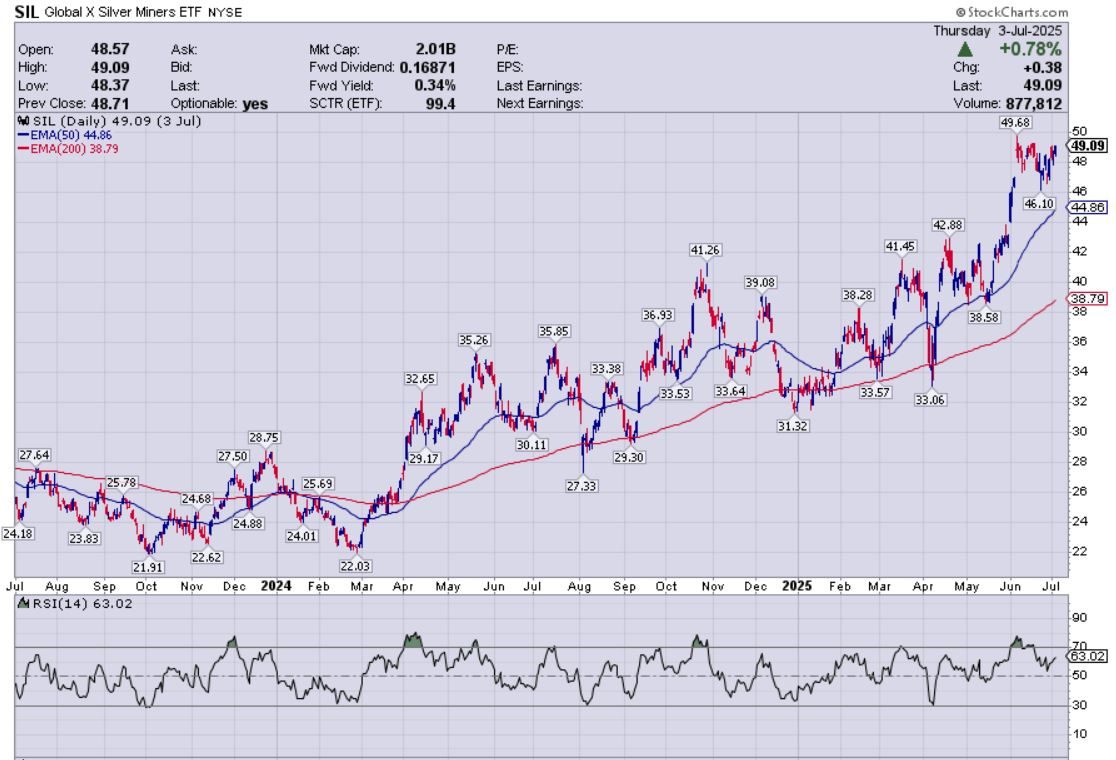
After seeing the the W-shaped double-bottom at $21.91 in Sep of 2023 and $22.03 in late Feb of 2024, we’ve seen the (SIL) ETF more than double since March of last year, up 225% from low to high.
(SIL) remains in a bullish posture above the 200-day and 50-day Exponential Moving Averages, and it is still not too overbought on the RSI with a Friday reading of 63.02.
It’s nice to see that the senior silver stocks finally got the memo and are starting to factor in the higher silver prices. This recent further acceleration happened in tandem with silver breaking out above $35, and has investors starting to look ahead to a robust Q2 earnings season. We’ll start getting those Q2 financial results over the next month or so, and they could be further catalysts for advances upwards.
Now let’s check in on Dr Copper, and what the diagnosis is on the health of the global economy at present.
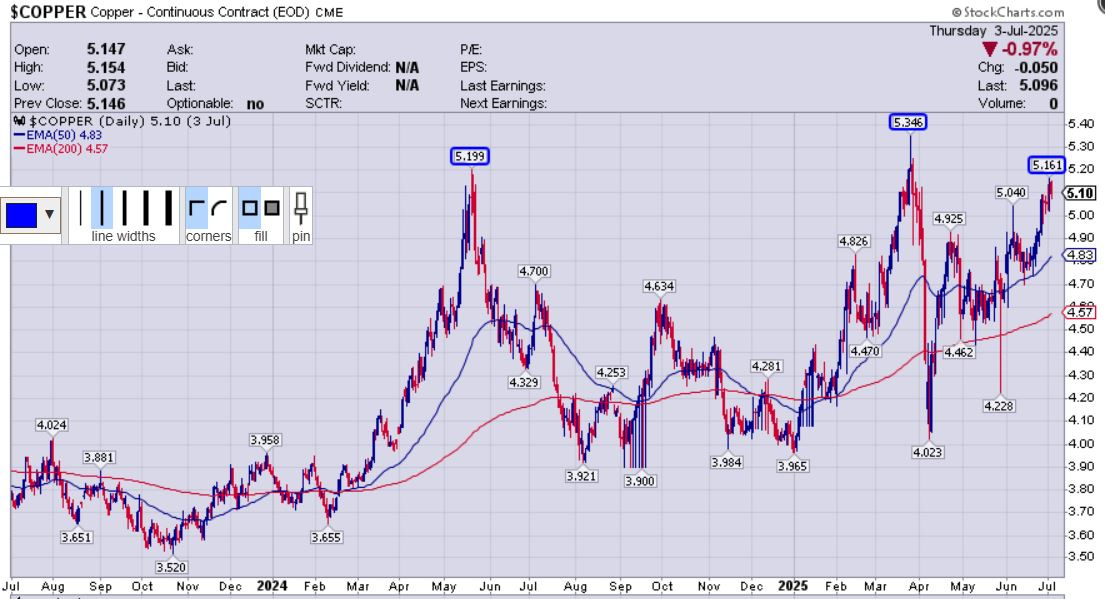
Copper is back above $5 for the 3rd time since May of 2024.
Similar to what we just discussed with Silver, where it broke through on the 3rd attempt; it is quite possible that we see the $5 handle stick, and that company valuations start reflecting that price level in the red metal moving forward.
Technically the futures price chart is really messy, with lots of whipsaw moves, but copper has still been gradually sloping higher in price; as evidenced by the moving averages gradually sloping higher since late 2023.
Of course, we could see the good doctor fall out of bed again next week, because we don’t know what is coming with regards to US tariff policy. Copper really crashed fast, going from it’s all-time high of $5.346 in late March down to $4.02 in just 2 weeks time in early April. So, anything is possible with economic outlooks repeatedly switching on a dime.
Overall though, this doesn’t seem like a medical diagnosis from copper of the global economy slowing into an extreme recession (at least not at present price levels north of $5). If anything, this move higher in copper fits into the reflationary bucket of growth expectations. Will that change next week on the back of the lift in reciprocal tariffs? (nobody knows but it seemed important to document this moment in time as a marker, to see how things may change over time).
Yes, people are also quick to point to copper moving higher very recently in price as manufacturers try to procure it ahead of the next round of tariffs. However, that doesn’t come anywhere close to explaining the move higher for the last 2 years in this energy metal crucial for infrastructure and electricity. We’ve had a chorus of recession calls for the last 3 years, and so far it never came… and copper moved up.
If it was just copper spiking up in isolation, then it would be unique… but again, we are seeing silver ramp to its highest levels in 13 years, platinum to its highest level in 13 years, aluminum rebounding above pre-Liberation day levels, and uranium taking off. Commodities overall have been inflating to higher prices.
That is definitely not what markets would be doing if we were already in a recession or if one was imminent.
Additionally, the economic reports for inflation, jobs numbers, GDP estimates for Q2, residential real estate prices, retail sales numbers, Q1 earnings and Q2 expectations, etc… have been coming in consistently better than many doom & gloomers have been warning against for years now.
I’m not saying or even suggesting that “everything is awesome,” I’m just saying that we haven’t had a recession the last few years, when so many people have been calling for one every week and every month. The metals price advances are also not indicating, at least thus far, that we are in a crashing growth environment, domestically or internationally. They are in growth mode…
Looking at the senior copper producers, by way of the ETF (COPX), they’ve not really capitalized on these higher underlying commodities prices in 2025, like they did in 2024. This is curious and confounding.
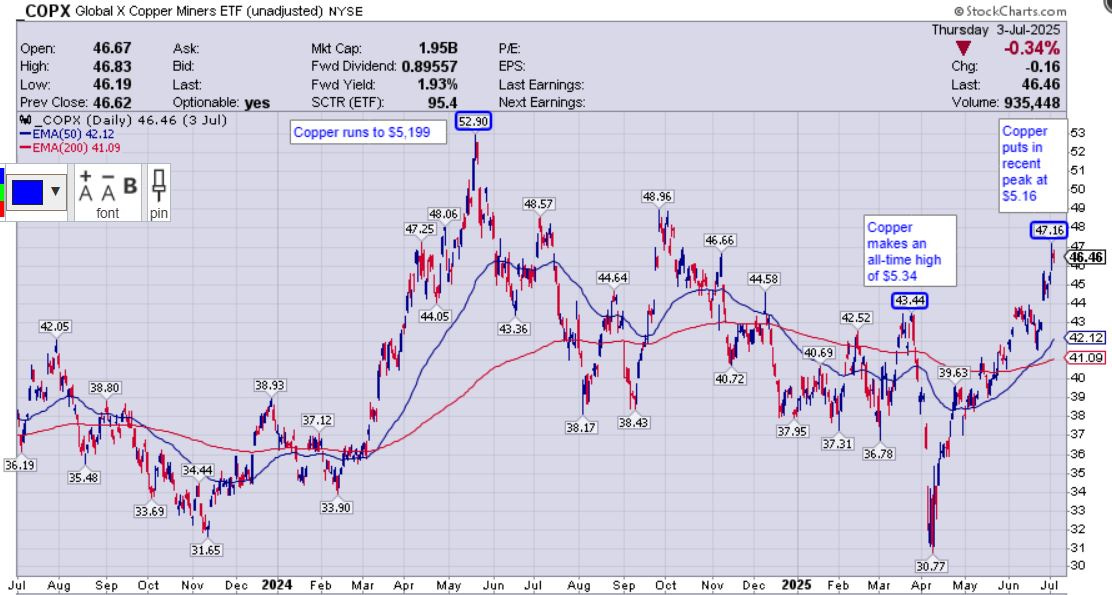
We can see on the (COPX) chart above that the peak in valuation was back in May of 2024 at $52.90, coinciding with when copper prices broke $5 the first time — getting up to $5.199.
However, when copper prices broke up to all-time highs of $5.34 in late March and the (COPX) put in a much weaker rally, only getting up to $43.44. What is going on there? Why such a weak rally on even higher underlying metals prices?
Also troubling is that when copper prices moved back down to $4.02 in April of this year, sure that was a big crash, but that was still a higher low than any of the copper lows in 2024. Despite this higher low in copper, the (COPX) fell all the way down to $30.77, far lower than all those lows in (COPX) from last year. That is not bullish strength. (COPX) outperformed, but to the downside.
On this recent rally back above $5, copper put in a recent peak of $5.16 this first week of July, and the (COPX) got up $47.16. I guess that is better than the weak response in March, but still pales in comparison to the rally in May of 2024.
The (COPX) is bullishly above its key moving average, but also getting in overbought reading on the daily chart on a number of metrics (RSI, CCI, TSI, etc…)
(COPX) has had good recent price action, but it’s still not the kind of bullish momentum we saw last year, and has been a more muted response to higher copper prices thus far in 2025.
Most of the copper producers have been enjoying the margin expansion at these higher prices, so eventually those revenues may start tracking with investors.
Let’s wrap things up with the uranium sector.
Since we just had a big update on the continued nuclear power catalysts being a boon to nuclear and uranium stocks, I’m not going to belabor the point here in this article.
For those that missed that article, here it is for quick reference:

The spot uranium price is back up on the high $70s, closing most recently at $77.40. Momentum has been to the upside since bottoming in the low $60s in March/April.
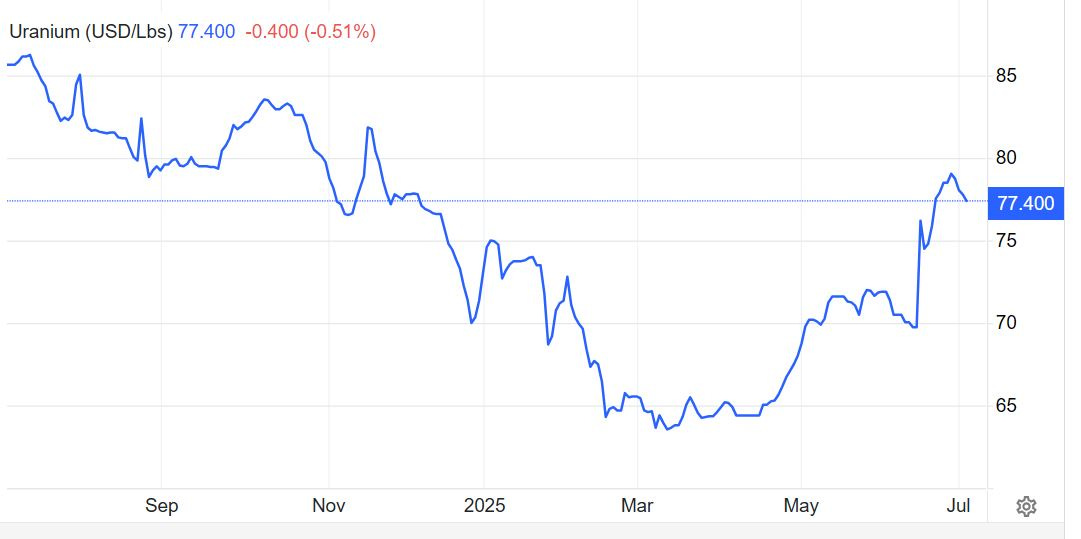
Uranium pricing has also been at higher levels in late June and early July than it has all year long, so it ended the 1st half of the year on stronger footing.
Bulls will want to see the spot pricing close the gap on term pricing (still north of $80) and at least hold steady in the mid $70s to keep momentum in the related uranium equities.
With regards to the U-stocks, let’s have a look at the uranium equities via the ETF (URNM).
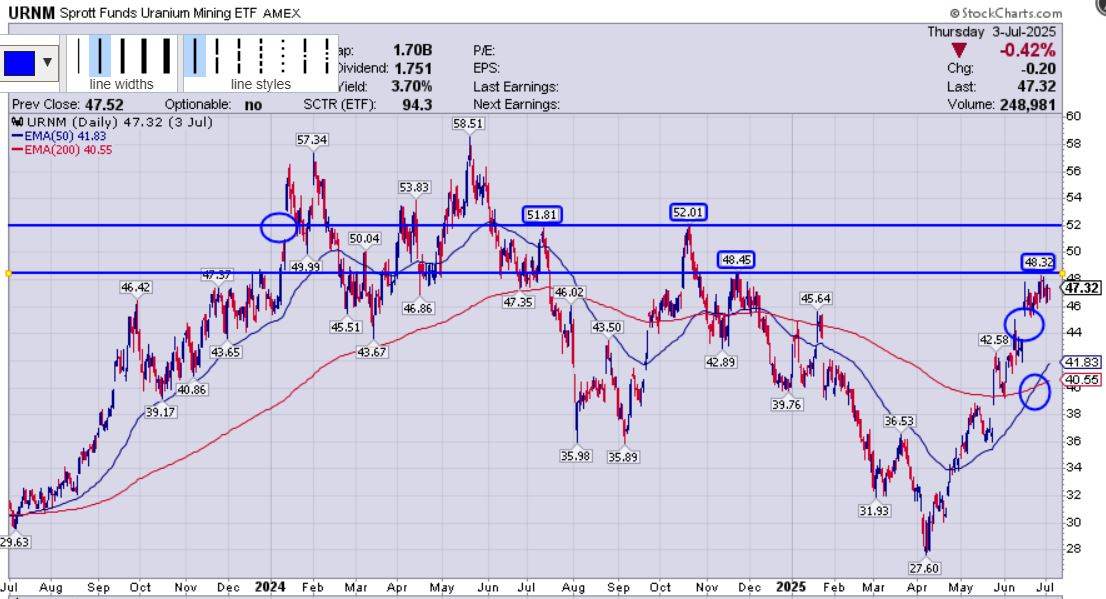
We’ve seen a nice rally in (URNM) off the April low of $27.60 up to the recent peak of $48.32.
Pricing in (URNM) is now above both 200-day and 50-day EMAs = bullish.
The 50-day EMA has done a “golden cross up through the 200-day EMA, which is also bullish.
The recent peak at $48.32 was slightly lower than that November peak at $48.45. That area is the next resistance to see (URNM) close above decisively. Going back in time, we see a lot of chart pricing congestion on either side of $48.
The next level for the uranium mining stocks in (URNM) to clear, after $48.45 is eclipsed, will be to see pricing close above that lateral pricing resistance in the $51.81-$52.01 zone.
In the near-term, it wouldn’t negate the bullish trend in (URNM) to see pricing go back and fill that recent June gap around +/- $45. That would be considered a healthy back-test in pricing and “filling the gap.”
Medium to longer-term, I’m most bullish on the fundamentals for uranium over most other commodities, and will not be surprised to see (URNM) blast past the prior peaks in the high $50s and head well into the $60s and then eventually make a trek towards triple digit prices. One step at a time though, as noted above.
Over at the KE Report this last week, we had some good conversations on this mid-year point in the commodities and resource stocks. For example, here are the 2 interviews that aired on our Weekend Show, featuring Joe Mazumdar of Exploration Insights and Dave Erfle of Junior Miner Junky.
Thanks for reading & listening and may you have prosperity in your trading and in life!
Shad