
While Gold and Gold Stocks Continue To Shine, Dr Copper Has Been Starting To Dance Like Nobody’s Watching
Excelsior Prosperity w/ Shad Marquitz (03-20-2025)
Gold 1-year daily chart:
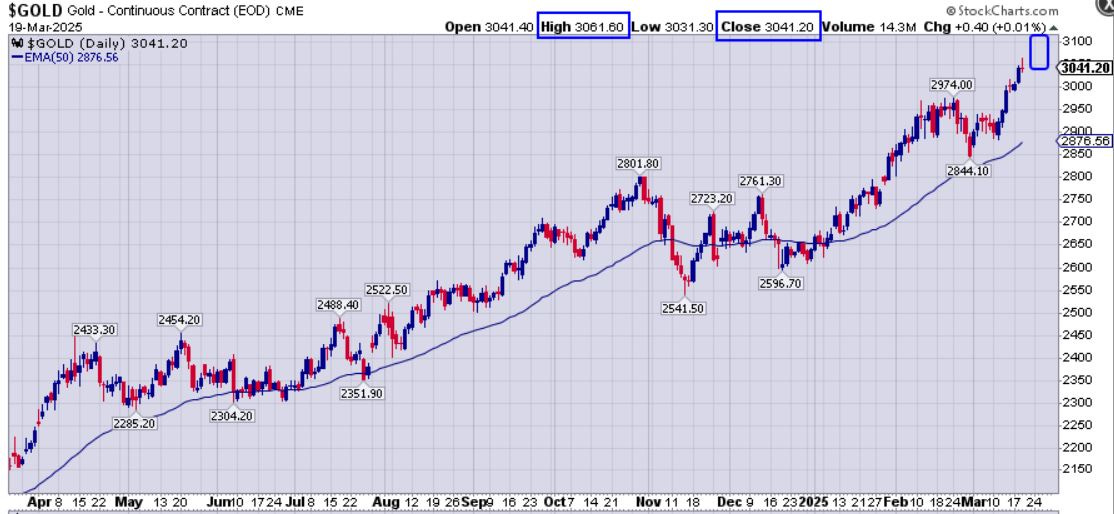
I’m a little surprised that the psychological round number of $3,000 didn’t put up much overhead pricing resistance; like $1,000 and $2,000 did when those levels were first approached. Maybe most people are just comfortable with $3K gold, and it is possible investors feel it is fairly priced north of that level all things considered on the macroeconomic and geopolitical front.
On Wednesday gold went up and tagged a new all-time intraday high of $3,061.60, and closed at $3,041.20, well above that $3,000 line in the sand.
We’ve seen record after record on the daily, weekly, and monthly gold charts for a long time now, which is undeniably bullish. All markets have corrective moves to the overall trend. Maybe the move down in gold from mid-February through early March is all we are going to see for the near-term. However, it is generally unwise to extrapolate out recent activity to infinity and beyond, or to get complacent that a trend will stay in motion with no counter-trend pricing action.
The gold price is still well above the 50-day Exponential Moving Average (EMA), which keeps it in a bullish posture. If one looks critically though, pricing is getting pretty stretched above that level, and at one point the yellow metal will need to take a rest. The strength of this gold bull has been relentless pressure to the upside, and to very little fanfare. Let’s hope that can continue, but also be prepared for the inevitable corrections along the journey.
Let’s look at the GDXJ 1-year daily chart:
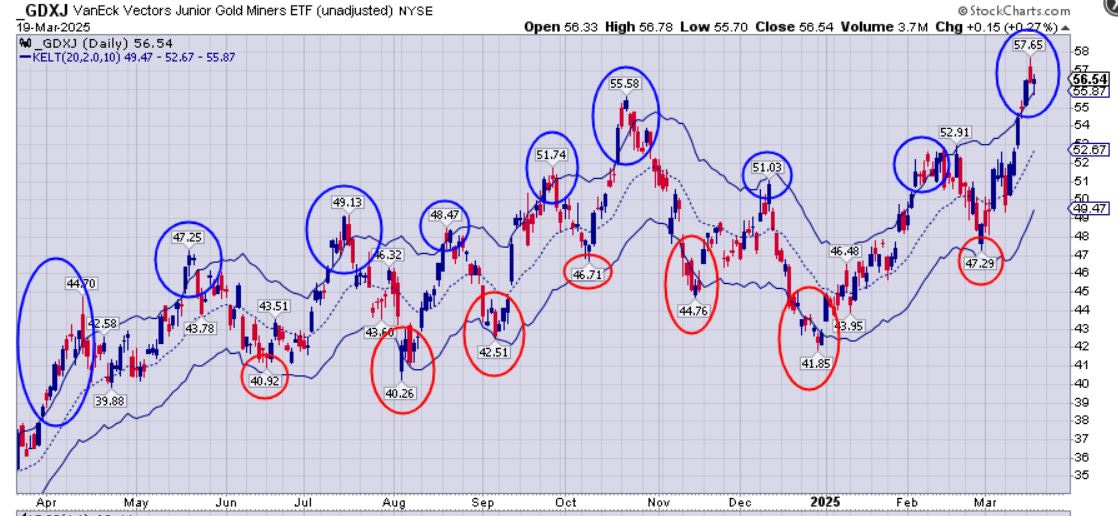
GDXJ hit a new recent intraday high on Tuesday up to $57.65, and then closed on Wednesday March 19th at $56.54, so pricing is now well above the October 2024 peak of $55.58. (just as an update, I’m using the figures that generate on the chart when you take the price action as it actually closed, and don’t adjust it for dividends. Both are valid approaches, but we want to look at how this trades on just pricing alone).
I dropped a Keltner Channel (K.C.) overlay on this GDXJ chart after looking at a few different overlays and realizing that it respects these standard K.C. parameters (20,2.0,10), for both support and resistance. That makes sense that a widely followed and liquid gold stock ETF would see pricing action neatly contained by these parameters. So, while the pricing in this ETF has been a wild whipsaw market back and forth, it is easy to see how there were constraints to it and “a method to the madness.”
Based on this pricing action in regards to the K.C., it does indicate that the GDXJ is a bit stretched in those regards. Pricing has been above the upper keltner channel bands the last 4 trading sessions, which is a condition that doesn’t typically persist many more days longer beyond that. It’s also interesting that pricing dropped all the way down to test that upper K.C. band on Wednesday’s trading. It would not surprise me to see pricing cool off a bit here and pull back down into the middle or even lower part of the K.C.
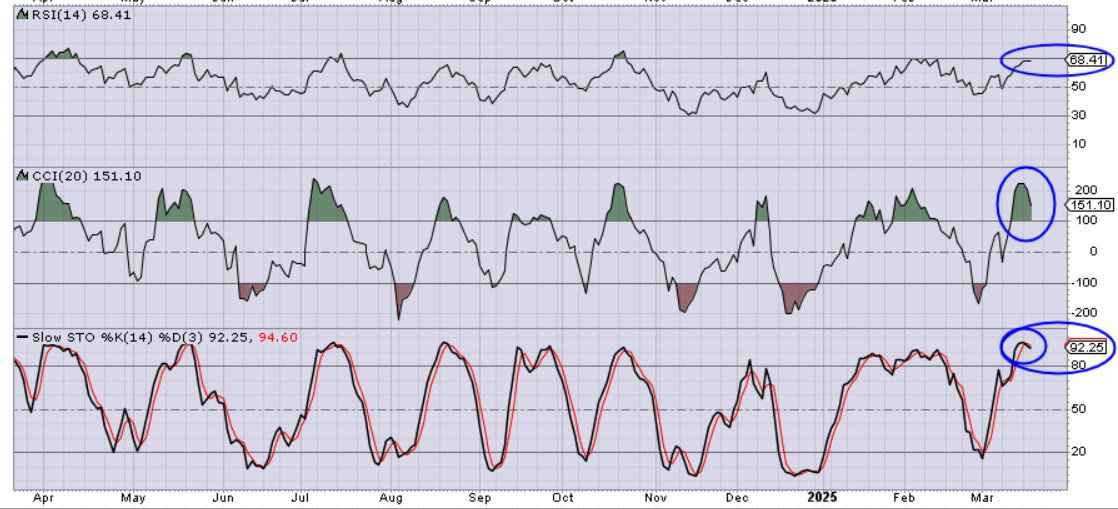
When looking at some strength and momentum indicators for GDXJ, the RSI is not really overbought yet with a reading of 68.41, so there is room for pricing to keep running. However, the Commodity Channel Index (CCI) has been up in nosebleed territory exceeding a 200 reading a few days back, and it is is now rolling over, and the Slow Stochastics is up at the very high overbought level of 92.25 and just made a bearish cross (black line going below the red line).
With this pricing backdrop on the GDXJ in mind, I decided to put some funds into the Direxion Shares ETF Daily Jr Gold Miners Index Bear 2X (NYSE: JDST) at the end of trading on Wednesday, as a hedge against my many long positions in gold and silver equities.
To keep this in perspective for readers here, this is a 3% portfolio-weighted position, so just small hedge… and its simply a trading position. {This is definitely not investment advice. I’m just sharing something interesting I see on the charts, and outlining my own personal thesis for placing this trade}. I will be fast to remove it if things turn up even higher in the gold stocks as it would hurt this inverse position. Conversely, I’ll also be fast to harvest gains on this trade if we see any notable pullback in the gold stocks in the near-term. The point being is that I’m not likely to camp out in this trade very long.
It is important to note that there is a difference between the longer-term positioning and overall weighting in one’s portfolio, versus short-duration swing-trades. In this case I’m overwhelmingly still long gold and silver stocks, but feel we are now near an inflection point for a potential turn, so I’m simply buying a little downside protection insurance by way of the 2x inverse ETF.
If the gold stocks do keep trending higher, then this trade will be a loss, but I’ll be grinning ear to ear from all my long gold stock exposure. However, if the gold stocks do correct down, in the near future… then I’ll use this hedge to make a little extra money to then deploy those funds raised into buying into any corrective move in the gold stocks.
It is good to get into the headspace, as an investor and trader, where one has a strategy for the market moving in either direction.
Maybe it’s a bad idea for me to share this level of detail with what I’m doing in my own portfolio with readers here that have a longer-term time horizon. There is the potential for people to get stuck on a small hedge trade and start thinking the wrong thing about my overall outlook. I’ve tried to be very clear in so many articles that I’m overall bullish the PM sector, just like I’m bullish copper, uranium, and nat gas, etc… However, over the years I’ve learned to hedge certain trends in general equities or resource stocks, when I see indications that pricing is stretched to the upside or downside at extremes.
My preference is for this hedge to be a losing trade, because it means most of my long gold stock positions are soaring higher. I simply had some spare capital to deploy, and just couldn’t see dog-piling on top of many long gold or silver positions that are already up high double-digit or triple-digit percentages. This hedged position is just a small way to reduce the larger risk being taken by having so many PM positions on the long side.
The key takeaway is that overall gold and the gold stocks have been shining brightly and making solid moves to the upside. It just seems like on a technical basis, and also based on the growing positive sentiment, that a “pause that refreshes” could be coming soon. This would actually be healthy and build the energy for the next leg higher. Again, maybe what we saw in late February through early March is the only corrective action we are going to see for a while. That would be amazing if that is what holds, but after such a big run lately, I’m watching this progress with a more vigilant eye than usual.
Now let’s shift over to Dr Copper, who’s been quietly dancing again lately like nobody’s watching.
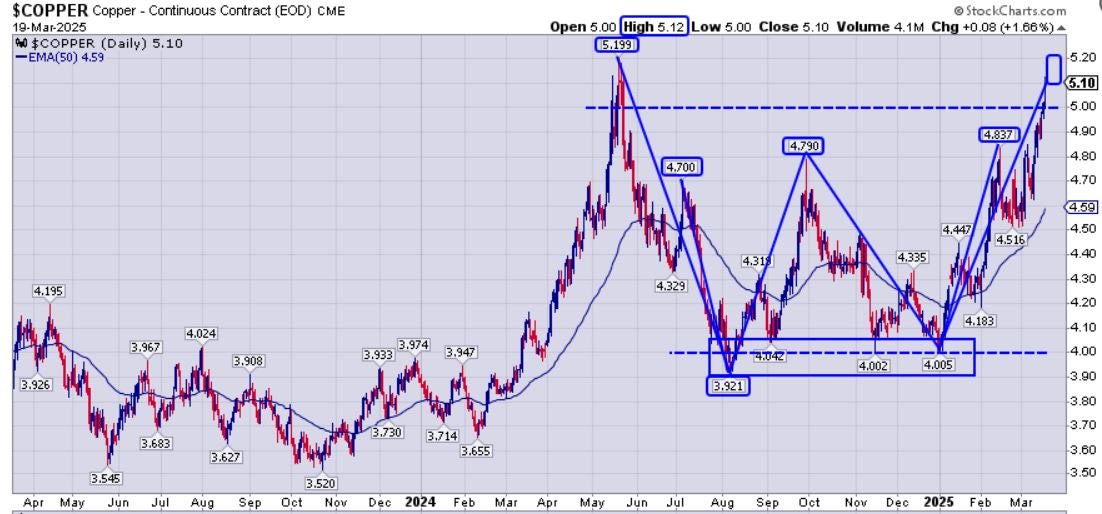
Copper made an intra-day high on Wednesday March 19th at $5.12, and closed the day at $5.10. It is very nice to see copper with a $5 handle once again. I included a dotted line at the $5 level and $4 level as they are round psychological dollar increments, and have mostly contained pricing.
We’ve noted in previous commodity updates that copper appears to have overlapping W-shaped double-bottom patterns in place, from both the July 2024 $4.70 to the February 2025 $4.837, but also the larger one at play from last year’s all-time high at $5.199 to the present pricing back up above $5.10.
Copper bulls will want to see pricing close above that $5.199 level from last May, and we are less than 10 copper pennies away from seeing the red metal do so. If a closing level above that is achieved in the near-term, then that would be very bullish; because making a new all-time high is always significant.
I quipped that Dr. Copper is dancing like nobody’s watching playing on the whole Dr. Copper putting on his dancing shoes motif, mixed with the lack of interest, discussion and overall focus from retail investors on what has been happening lately in this sector.

For such a key strategic and critical metal like copper to be up approaching its all-time highest levels in pricing ever, (once again), but then see so little fanfare about it and the muted reaction from copper stocks, is quite curious indeed.
Just have a look at the price action on the COPX 1-year daily chart:
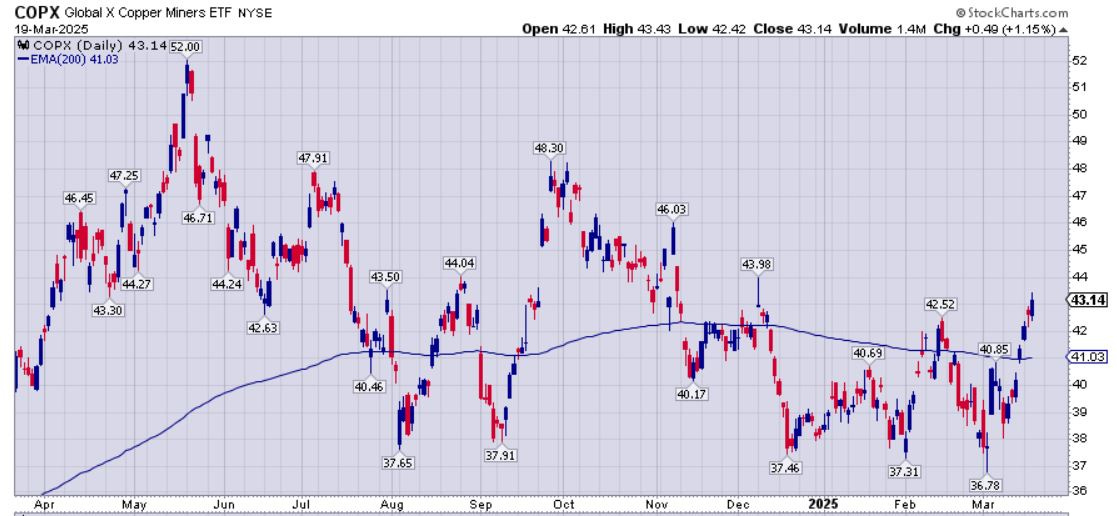
Even though Copper pricing is back up near the May 2024 all-time high level, the copper producers, represented by this Global X Copper Miners ETF (COPX) closed yesterday on Wednesday March 19th at $43.14, which is a far cry from the $52.00 peak hit at very similar copper prices last year.
Are all these copper producers suddenly 20% less valuable than they were less than a year ago at similar underlying metals prices? (that seems hard to believe)
COPX is back up above the 200-day EMA, which moved it out of its mostly bearish posture since the end of last year and into a more bullish posture once again… so that is constructive.
It is possible that copper stocks have a big catchup trade potential, if copper can stay up above $5 and hold it for a period. Just some food for thought…
Nick Hodge, Co-Owner of Digest Publishing and editor of Foundational Profits and Hodge Family Office, joined us over at the KE Report for a longer-format discussion on and the macro and micro themes that are disrupting the general equities markets and economic outlook. Despite the volatility in the markets, he still sees opportunities in gold, silver, copper, and uranium stocks.
Nick Hodge – Macroeconomic And Geopolitical Uncertainties, Yet Opportunities Remain in Gold, Silver, Copper, and Uranium Resource Stocks
Well that wraps us up for this technical review of gold, gold stocks, copper, and copper stocks.
Thanks for reading and may you have prosperity in your trading and in life!
· Shad