


Uranium Sector Update – Should Contrarian Investors Take A Flyer Here?
Excelsior Prosperity w/ Shad Marquitz – (08/25/2024)
It seems appropriate to do an update on the uranium space, because after a several-month bearish rout in the uranium stocks, we saw a big surge higher in the U-stocks on Friday’s trading action. This was on the back of supply concerns out of Kazatomprom, the largest global uranium producer in Kazakhstan. Uranium stocks went from zero to hero all in one day, so it’s worth exploring the significance of the news and market response in further detail. We also now have a bit more technical clarity on the failed cup & handle patterns, but also new questions on many of the uranium equity and ETF charts as they approach key overhead resistance.
So let’s get into it…
First up there was a widely circulated Bloomberg article out on Friday morning discussing the guidance miss for Kazatomprom by 17% on expected U308 production, and this is why investors were bidding up the uranium equities.
Uranium-Miner Shares Gain on Kazakh Output-Guidance ‘Miss’
By Geoffrey Morgan- August 23, 2024 at 6:24 AM PDT
“Uranium-focused investors in North America are piling into shares of miners of the nuclear-reactor fuel after the world’s largest producer, Kazatomprom, released guidance that fell short of market expectations.
Shares of North American miners surged Friday after Kazakhstan’s state-owned uranium miner said overnight that it would produce 25,000 tons to 26,500 tons of uranium next year. Analysts say that’s higher than 2024 levels, but notably below agreements that require it to produce within a specified range for the year.
Cameco Corp.’s shares jumped as much as 6.8% in in Toronto, while NexGen Energy Ltd. surged more than 11% at one point. Denison Mines Corp. jumped as much as 16%.
‘This brings the entire production curve guidance down for several years,’ Segra Capital Management founder Adam Rodman said Friday, calling the outlook a ‘miss’ and saying he’ll buy North American uranium miners as a result. Segra Capital already owns Vancouver-based startup NexGen and other miners...”
https://www.bloomberg.com/news/articles/2024-08-23/investors-rush-into-uranium-miners-on-kazakh-production-outlook
When Mining.com panned that piece in Bloomberg they ran with the title:
“Investors rush into uranium miners on Kazakh production outlook.”
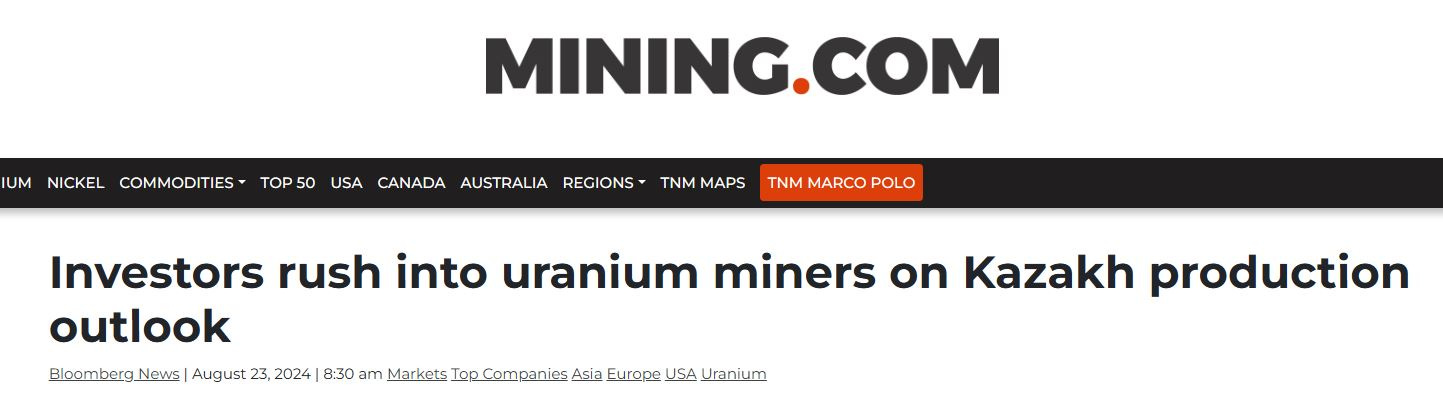
https://www.mining.com/web/investors-rush-into-uranium-miners-on-kazakh-production-outlook/
Then the most widely followed commenter on all things uranium and nuclear power on X/Twitter, John Quakes, put out a post flagging the production shortfall from Kazatomprom, kicking it off with the Moby Dick catchphrase: “Thar she blows!” (complete with an accompanying whale emoji… actually, with a lot of accompanying emojis…) https://x.com/quakes99/status/1826875537509548226
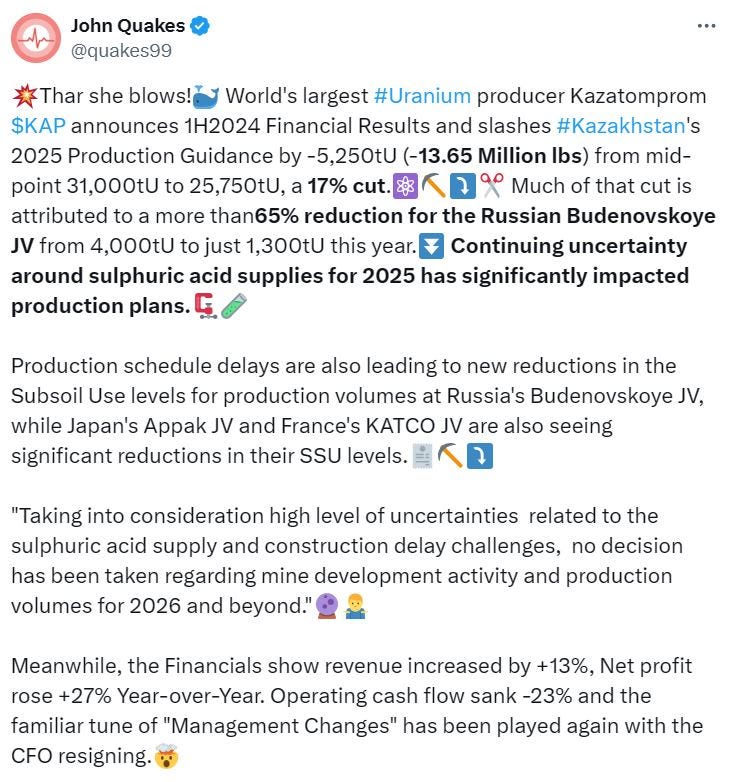
Summing up Friday’s media coverage, we had uber-bullish reactionary phrases thrown about:
“Uranium-focused investors in North America are piling into shares of miners…”
“Investors rush into uranium miners….”
“Thar she blows!”
Personally, as a uranium bull, and huge proponent of nuclear power as one of the crucial inputs to the energy mix, I’m thrilled to see some excitement back in the sector. It is particularly refreshing to see uber-bullish comments in the media after months of sour sentiment from investors, watching the uranium mining stocks share-prices drift lower and lower… What a difference one day and one news announcement can make!
The enthusiasm is well-founded, because Kazatomprom is the global swing-producer for this commodity, much like Saudi Arabia is to the oil sector. If they are going to be producing less than initially projected, then that IS generally supportive for the price action of the commodity, and for other producers or near-term producers that can provide alternate sources of supply.
In an article out on Yahoo Finance yesterday, Saturday August 24th, 2024, by Jeff Lagerquist titled "Cameco and Canadian uranium peers rally as world's top producer cuts 2025 target,” the following passage regarding the outlook from Sprott Asset Management stuck out to me as significant and in alignment with all the bullish sentiment to end last week:
“Data firm UxC lists a weekly price of US$81 per pound as of Aug. 19. Earlier this year, Toronto-based Sprott Asset Management predicted short supply could support prices above US$100.
Sprott CEO John Ciampaglia says while Kazatomprom's acid shortage is legitimate, the company is also interested in prolonging the current bull market for uranium.
"We know that the sulfuric acid shortages are real, and are not going to be addressed any time soon," he told Yahoo Finance Canada on Friday. "We also think there is an element of them being unwilling to increase production materially. Their message is very clear. They're focusing on value over volume."
OK, so everybody is all bulled up on this Kazatomprom news, and rightly so… However, didn’t we just see the same kind of excitement a few months ago, when they mentioned their 2024 guidance to date in their JV with Cameco, (at the Inkai Project), was going to miss production output by -18% for 2024? Or how about the new higher tax laws passed in Kazakhstan that were going to crimp future increases in supply?
People got all bulled up only for the rug to pulled out from under investors feet when Kazatomprom shortly thereafter mentioned they were going to exceed overall production in 2024 by 6%? (which the market was not expecting). That concession by Kazatomprom, despite all expectations to the contrary by the market that they were not going to exceed production guidance for the year, demonstrated that they were increasing production despite the prior messaging.
Making the analogy once again to Kazatomprom being like the Saudi Arabia of the uranium space is also fitting in the sense of putting out mixed signals to the market. Saudi Arabia, as the main ring-leader of OPEC+, will put out all kinds contradictory statements to the markets that whipsaw oil investors back and forth that are constantly trying to read the tea leaves on how supply will affect future pricing. It appears Kazatomprom is starting to take on that same role in the uranium sector, where investors “pile in” or “rush” to the bullish side of the boat on one news story, and then jump overboard to the bearish side of the boat on the next story.
In a recent interview I conducted on August 8th, over at the KE Report, with Justin Huhn, Founder and Publisher of the Uranium Insider; we were discussing the competing news stories and reactions from the markets around news out of Kazatomprom. [At that time it was an over-reaction to the downside.]
I’ll include it again for those folks that missed the conversation, because it was jam-packed with many topics germane to the uranium sector, and it is still quite relevant for a number of themes regarding buying from utility companies and the long-term contracting cycle, new supply from uranium miners in the US and Canada, and exploration projects with drilling underway in the Athabasca Basin.
Additionally, about 3 weeks ago I had another great discussion with Fabi Lara, Publisher of The Next Big Rush, on the fundamental drivers in both the larger nuclear power space and then for uranium supply/demand fundamentals. We got into the recent correction in uranium stocks, along with a lot of the individual uranium stocks in this interview as well:
So with all the fundamental news for the uranium sector, swirling around within a larger macroeconomic environment of Fed rate cuts, Japanese carry trades unwinding, the energy demands of proposed A.I. data centers, and on and on…. It’s easy to understand why investors are so easily whipsawed into or out of their positions. This is precisely why it is helpful to occasionally block out all the news and noise and just simply look at what the price action is doing. So… let’s look at the charts.
When we dig into the technical picture and assess where we are at it is helpful to reflect back to these passages in the last “Uranium Sector Update – Is There A Leak In The Cup?” on July 3rd. At the time the question for chart watchers was whether the “Cup & Handle” patterns had actually broken down or not. We also pondered moving into July if the U-stocks could get out of the danger zone and decisively bounce back off (or get back above) the 200-day and 144-day Exponential Moving Averages (EMAs), or if they were going to break down further, accelerating the corrective move.
Here’s where things were at a little over a month and half ago:
Well, as most investors following the uranium stocks know all too well… the sector has continued to weaken and further correct during the month of June. Some folks could argue that the cup & handle patterns in the ETFs (URA) and (URNM) could very well still be in play for an eventual resolution higher, and that we just consolidated for another month. However, another group of technicians looking at the charts could make the case that the cup and handle patterns have now broken down, where the handles have become too extended or pulled back too far for the pattern to still be valid. I can understand both lines of thinking, and we’ll dig into that debate in the charts below, and look at both the bull case and bear case. This is why I titled this article, “Is There A Leak In The Cup?” as a tongue-in-cheek callback to the prior article, and pondering if the cup-and-handle patterns have broken down.
Sure, I guess one could say in the URNM cup & handle pattern that the recent low of this consolidation at $48.69 has been above the recent low at $48.19 and well above the low of the cup at $44.91. However, that is a really long handle, and most wouldn’t have expected it to have extended so low and for so long, so it is possible that the pattern has broken down. We’ll know in the next few weeks and months to come, if we get a bounce here off the 200-day moving average that sends this pattern resolving positively to the upside, or if current support breaks setting up a bigger downside correction.
[Continuing on discussing the URNM ETF] - Pricing blasted higher off support in late April and up higher into mid-May, where pricing put in a new intermediate peak of $60.17. Since that high-water mark, pricing has consolidated lower in mid-May, June, and to kick of July. There was initially some support at the 50-day and 144-day EMAs, but ultimately it has been the 200-day EMA getting tested over the last 2 weeks. This seems like a good place to layer on more uranium positions, for the potential bounce. However, if this 200-day EMA gives way after this consolidation (similar to what we saw at the 50-day and 144-day EMAs when they gave way) then we’d be in bigger technical trouble. So it’s make it or break it time in this URNM ETF.
So as an overall takeaway, URNM, Denison, enCore, and Uranium Energy Corp all have charts where pricing is either testing lower support levels, or that has broken down below key EMA support in bearish postures. As a result, pricing could keep correcting down lower, and so bulls will want to see pricing rally back up above 200-day and 144-day EMAs to get into a more constructive technical setup. It’s been tough sledding in the uranium mining stocks over the last 6 weeks.
Well, we now know that those cup and handles did become failed patterns, with pricing decisively breaking down through all the key moving averages in a bearish trend during July and into August. The question now is whether this big bounce we saw to end last week on Friday will see some legitimate follow-through next week, and the weeks to come?
Let’s look at where pricing closed last week though in URNM:
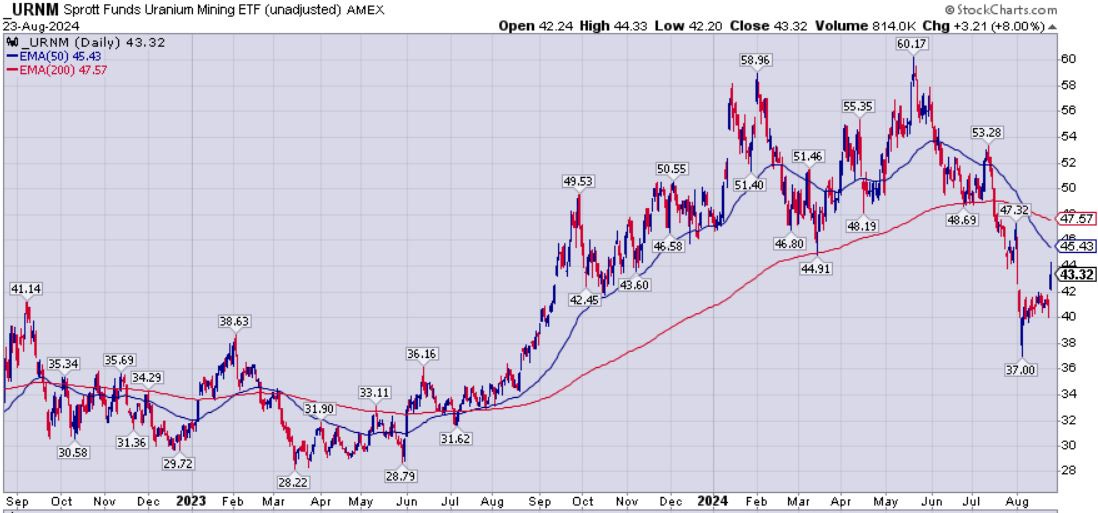
(URNM) closed up to end last week at $43.32, which is up nicely off the August low of $37.00, but still below the 50-day Exponential Moving Average (EMA), currently at $45.43, and also below the 200-day EMA, currently at $47.57. That means this chart is still in a bearish posture until pricing can get decisively back up above those 2 key moving averages. It also very much looks like those prior peaks this year at $58.96 and $60.17 were more of an intermediate-term double-top for the uranium mining stocks (hence the fall out of bed lower in pricing after that 2nd high in May through early August). Is the rout the rout over? We’ll know when pricing reclaims the EMAs.
Now let’s pivot over to the weekly chart of (URNM):
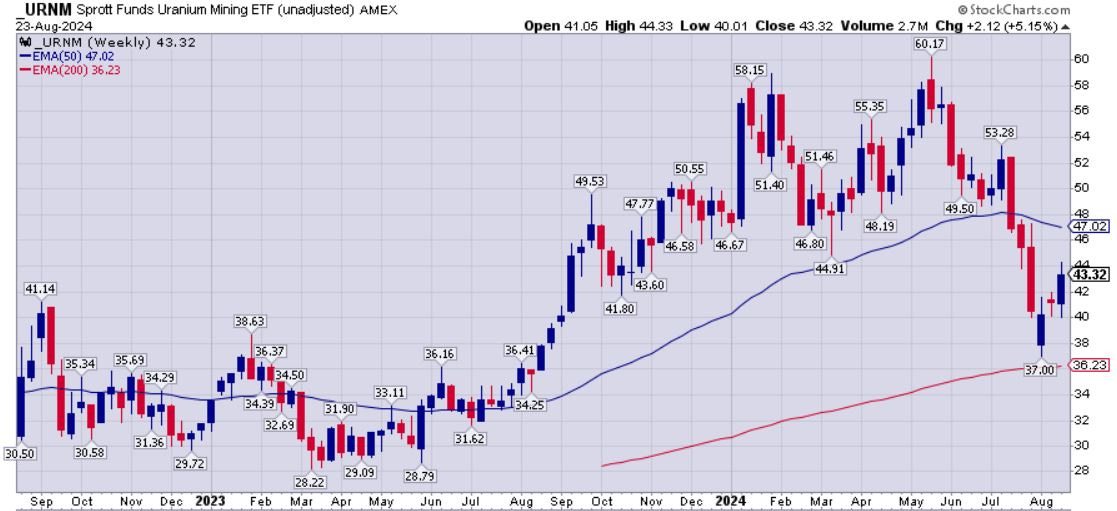
Zooming out to the weekly chart, (URNM) at $43.32 is still in a bearish posture well below the 50-week EMA, which is currently at $47.02, but that spike low down to $37.00 in early August turned around before getting down to the 200-week EMA, currently at $36.23, so that is a better outcome than if it had broken down below that support level. Uranium stock bulls will want to see pricing continue to advance higher and get back decisively above that $47.02 level for the 50-week EMA, and that aforementioned 200-day EMA level, currently at $47.57. So in a nutshell, we need pricing back up above $47.60 to regain a bullish posture.
Let’s also look at a few widely followed individual uranium stocks for an indication of how significant Friday’s bullish trading action actually was on the charts. I think you’ll see it was encouraging, but we’re not out of the woods yet.
Uranium Energy Corp (UEC) daily chart:

Pricing in (UEC) closed at $5.37 on Friday, after going up and tagging the 50-day EMA, currently at $5.53. Pricing still closed last week below both the 50-day EMA, and the 200-day EMA, currently at $5.98, so that still has pricing in a bearish posture. We’ll need to see some follow through this next week to get pricing back up above those overhead resistance levels.
enCore Energy Corp (EU) (EU.V) daily chart:
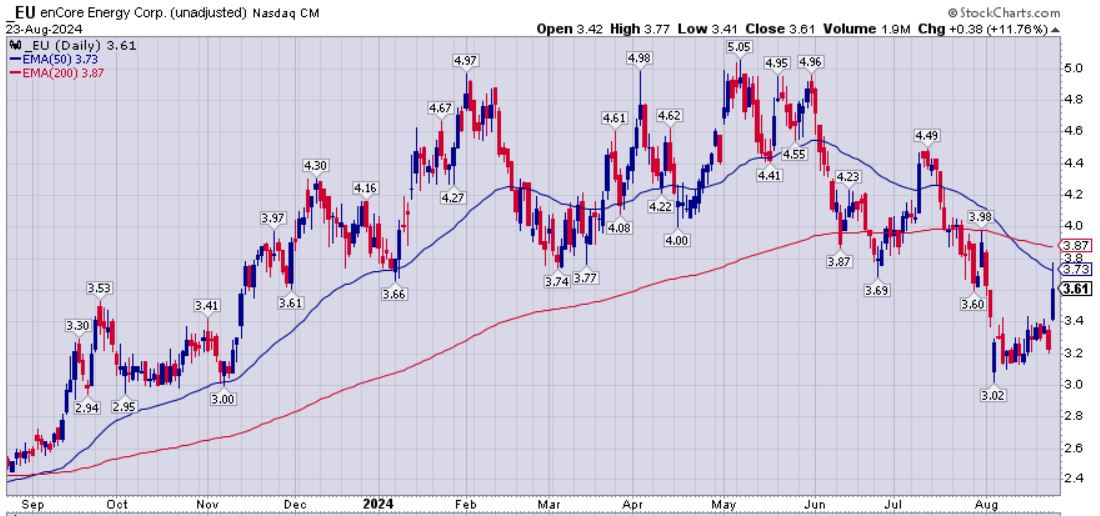
It’s the same pattern here for enCore Energy, a US-based uranium producer, with pricing closing last week at $3.61, below both the 50-day EMA, currently at $3.73, and the 200-day EMA, currently at $3.87. It’s not that far from getting back on top of those overhead resistance levels, and it did tag the 50-day EMA on Friday before getting swatted back down. It looks close to reversing fortunes here, but bulls will want to see it rise above those resistance levels.
Denison Mines (DNN) (DML.TO) daily chart:
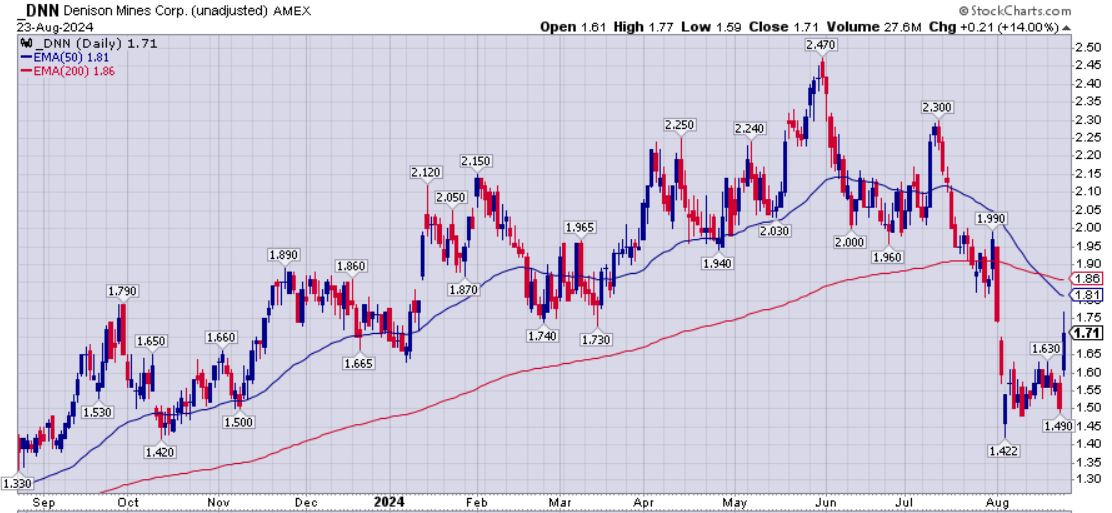
You guessed it… same pattern for Denison Mines. Despite the huge move higher of 14% on Friday for DNN, it still closed last week at $1.71, below both the 50-day EMA, currently at $1.81, and the 200-day EMA, currently at $1.86. Again, uranium bulls will want to see pricing decisively close above those levels in the week(s) to come.
So there you have it… yes, the projected miss of 2025 production from Kazatomprom is encouraging, but investors have been caught wrong-footed by mixed messaging from their production guidance just as recently as a month ago. Let’s keep things in perspective, and remain a little skeptical of how things will go in 2025 until we at least wrap up 2024. However, any way one looks at it, there are a number of bullish factors stacking up in favor of nuclear power, of supply/demand imbalances in U308, and a longer-term multi-year uranium rally that should be sustainable.
As for the pricing: Yes, last Friday’s surge in the equities was very encouraging, but one day doesn’t make a market. We need to see follow-through conviction and further pricing advanced in the week and weeks to come to get those pricing charts out of a bearish posture, and back into a bullish posture.
Should contrarian investors be taking a flyer here on a breakout in the U-stocks? Well, I can’t offer investing advice, and everyone needs to make up their own minds and take action based on their own unique risk/reward criteria. As I stated in prior articles and updates, my personal approach was adding to my 10 uranium stock equities all summer long, when many were throwing out the U-stock babies with the negative sentiment bathwater.
Thanks for reading and may you have prosperity in your trading and in life!
- Shad