


This Time It Is A Gold Breakout, Not A Fakeout
Excelsior Prosperity w/ Shad Marquitz (03/09/2024)
While it may seem like an obvious statement, that we finally have a legitimate gold breakout, strangely enough not everyone has been on-board as it has been playing out. This stems from there being so many shell-shocked precious metals investors, that have seen the sector implode over and over again, that there is still a strange amount of hesitancy to accept this recent breakout staring people right in the face.
So, let’s remove the emotions and narratives about why gold could be breaking out (there are a myriad of them) and look dispassionately at the charts for a sum total of all human and machine buying for all reasons into the pricing action.
First though… let’s turn back the calendar to a few months ago…. (this may get a bit granular, but it is definitely worth the deep dive for a greater understanding of the breakout we’ve seen in gold). We’ll get to the recent move up to see gold close Friday 03/08/2024 at a new all-time daily/weekly high of $2185.50 eventually, but not before laying the appropriate groundwork first.
It is extremely important to back up the clock and look at what happened on Friday December 1st, 2023, which is where gold first broke out. Many investors and market pundits have forgotten all about the new all-time daily & weekly high that was put in on the futures pricing chart that day, which kicked off the rally that has followed the last few months. In reviewing this day’s pricing close and significance again, with so many market pundits, their reactions and feedback has been so very very strange. It’s like PM investors have amnesia here about this day and it’s importance on a technical basis. The reason being that this key technical daily/weekly close to to all-time highs, got immediately eclipsed and overshadowed by the wild action that occurred on the following Sunday night in overseas trading. (we’ll get to that in minute, but it’s important to note that the Sunday trading didn’t happen during normal North American trading hours and thus didn’t officially “count” on the charts in the traditional sense).
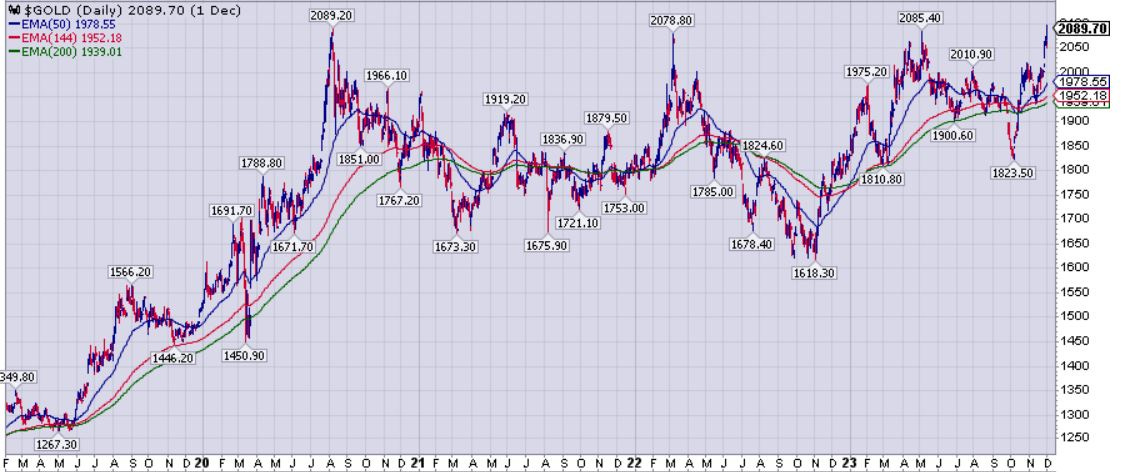
Let’s get back to December 1st though, as this is so important to understand. The new all-time closing high, on the futures market prices during a normal session, came in at $2089.70. This was only $0.50 higher than the prior all-time high in August 2020 at $2089.20. However, if one is really being “technical” and applying “analysis,” which is kind of the whole point of T.A., then it was a record-breaking moment and showed gold was still in a bull market after a 3+ year consolidation and had broken through the 2020 peak on a daily/weekly closing basis.
This was also significant because it dismantled the narrative that gold was being rejected downward due to putting in a “Triple Top”: ($2089.20 in August of 2020, $2078.80 in March of 2022, and $2085.40 in May of 2023). Double Tops and Double Bottoms are quite common in T.A, but many technicians reject the idea of Triple Tops and Triple Bottoms, because if a resistance or support area gets tested that many times it is eventually going to break (not it can’t happen, just that it is rare and not really a “thing.”) In my messaging, I had been steadfast over and over again that there wasn’t any “Triple Top” threat, and that instead gold would keep “knocking on heaven’s door” until it broke through… and now it officially had on the 4th attempt.
It was very surreal to see this all playing out right at the end of the week on a Friday, when so many had already mentally checked out for the upcoming weekend. It reminded me of a being at some prior sporting events, where much of the crowd had already left the stadium, assuming they knew the outcome of the game, only to see things get wild in an upset during the last few minutes. I remember being absolutely glued to my computer screen and frantically toggling between multiple platforms, (because some financial platforms like Yahoo and Bloomberg were showing moves up $2091/$2092 in the final trading hour = power hour). Initially they showed those figures of $2091-2092 for the closing price, before after-hours trading had even started, but then this cascaded into after-hours trading, and all got comingled so it was very hard to know where gold futures actually closed. All I knew was it was a new high close.
Well, after the dust settled (30 minutes later) and some charting services like Stockcharts parsed the data, the session close was officially logged at $2089.70. I remember being bummed it wasn’t at least registering the $2090-$2091 area that was displaying on many platforms during the end of regular trading; but whatever, it was a new historic high for the monetary metal, and great way to end the week.
Now, I distinctly remember being very excited about this and messaging my business partner at the KE Report, Cory Fleck, and proclaiming “a new all-time high for gold today.” He simply sent me back over a party hat emoji. I also texted a quick message to my buddy Dave Erfle about the breakout in gold, and he quipped back, “Yes, a new all-time high by 50 cents!” It wasn’t much, but it still counted, and was a great way to end the week. I went out to the beach with my lady to crack open a craft beer and watch the sun set over the mountains and ocean together. All was well in the world again…
So, if that reality had truly set in, and had the proper time for people to really marinate on it, then more people would have heard the bull market bell ringing far earlier than merely just 2 weeks ago. Gold had already broken out… even if was only by a hair, but the signal was there. However, this good news was quickly lost on most people due to what happened 2 days later…
The issue arose in people’s minds where they forgot a new ATH was achieved on the December 1st close, and even higher levels in after-hours US trading, because of the overseas fireworks in Asian overnight trading on Sunday December 3rd. In the very early hours for North American investors, the yellow metal scorched up to a intra-night high of $2152.30. So… all that people cared about or talked about that next Monday morning and beyond was that wild move above $2150 in Asian markets. They had already forgotten all about the Friday daily/weekly close at $2089.70 that was a legitimate and factual breakout on the charts.
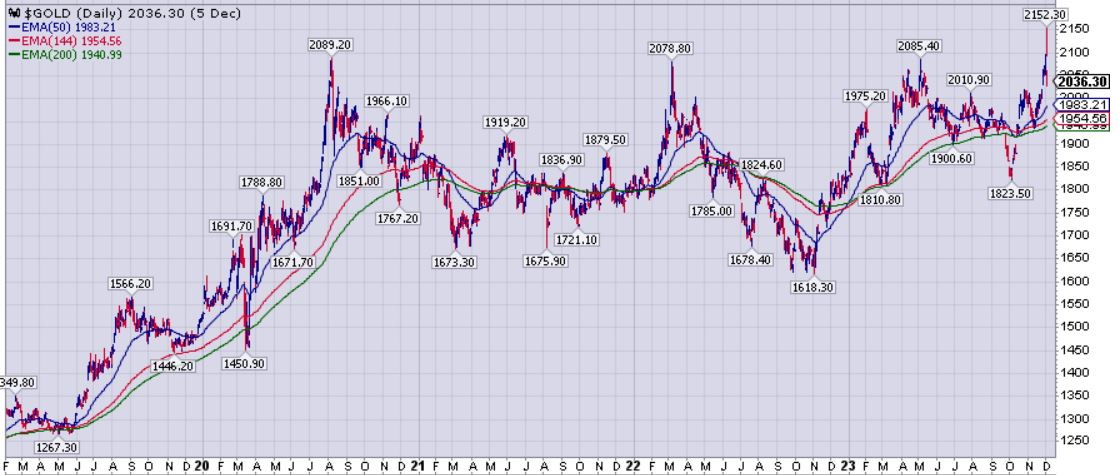
One can see the dilemma looking at gold charts that first week of December, as the ATH from then on showed as that $2152.30 from overseas trading, eclipsing the more important closing high of $2089.70 from Dec 1st. So due to the rapid-fire sequence of events that followed, the key factoid of a gold breakout, seemed to have been buried in the dustbin of precious metals history almost immediately after taking place. Sure, most people noted the big move higher in Asian markets, but then immediately discounted that high water mark, regurgitating that “it didn’t count as an all-time high on the standard charts, because it didn’t happen during the normal US trading session.” (OK, but the $2089.70 did count, but since it doesn’t show on the charts as the high, then it was out of sight and out of mind).
The excitement didn’t last long on the proceeding Monday, Tuesday, Wednesday, as the gold price was quickly monkey-hammered back down in the lower $2000’s in to the $2070-2030 region. In a matter of hours and days the sentiment had gone from euphoria to complete despondency, and many pundits proclaimed, gold was still in a bear market (WTF?) and that it just “wasn’t allowed to break out” due to (you guessed it) manipulation. Both comments are silly because nobody had held gold back from officially breaking out to new highs on the previous Friday on that weekly close. There was bullish action hiding in plain sight, and yet all anyone could focus on was the bummer of a fall from $2152 to down in the lower $2000s… well that is until the end of the month where things perked back up again.
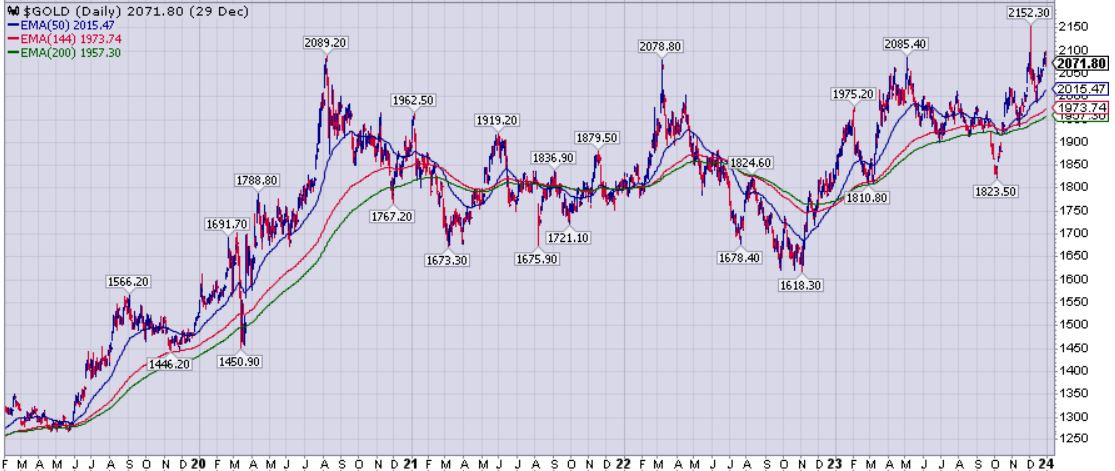
As the markets unfurled the last month of the year, an all-time monthly, quarterly, and annual high of $2071.80 was painted on the December 29th close, which is too significant to understate.
Stock technicians will give lip service all the time about the importance of the longer-duration charts (monthly, quarterly, annual), and yet they were deafly quiet about this stellar breakout on those major charts for the yellow metal to end 2023. The glaringly obvious fact is that on all those longer-term charts, Gold had shown it had broken out into the next leg of it’s bull market. It was clear as day, and yet some technicians proclaimed gold was still in a bear market. (impossible)
How in the world can an asset class be in a bear market if just punched up through all-time closing highs to finish the month, quarter, and year at the highest level in human history? [Without a doubt, gold was showing once again that it already was in the next leg of the bull market on the major charts. For any serious technician to have disputed that when 2023 wrapped up is simply ridiculous.]
Look, I can understand technicians, that didn’t feel a $0.50 close higher on December 1st to make a new daily/weekly all-time was enough for them to feel comfortable proclaiming a breakout. However, it technically did count and was, in fact, a breakout. Then the higher after-hours trading a few bucks higher, and the huge surge in Asia 2 days later was just further confirmation of the next bull leg being underway. However, there is no technician worth their salt that could possibly conclude that the way the month of December, or the 4th Quarter, or the whole year of 2023 wrapped up at an all-time closing high of $2071.80 was not uber bullish and a definitive breakout on the longer-duration charts. Period.
And yet… many technicians and market observers, were still not convinced, and kept stating publicly that gold was still in a bear market. (Oh really….??) Look, bear markets continue correcting down over time, making lower lows. Bear markets do not ever breakout to all-time highs on the daily, weekly, monthly, quarterly, or annual charts. That is what bull markets do. This is technical analysis 101 and for anyone to state something different is just plain silly and incorrect.
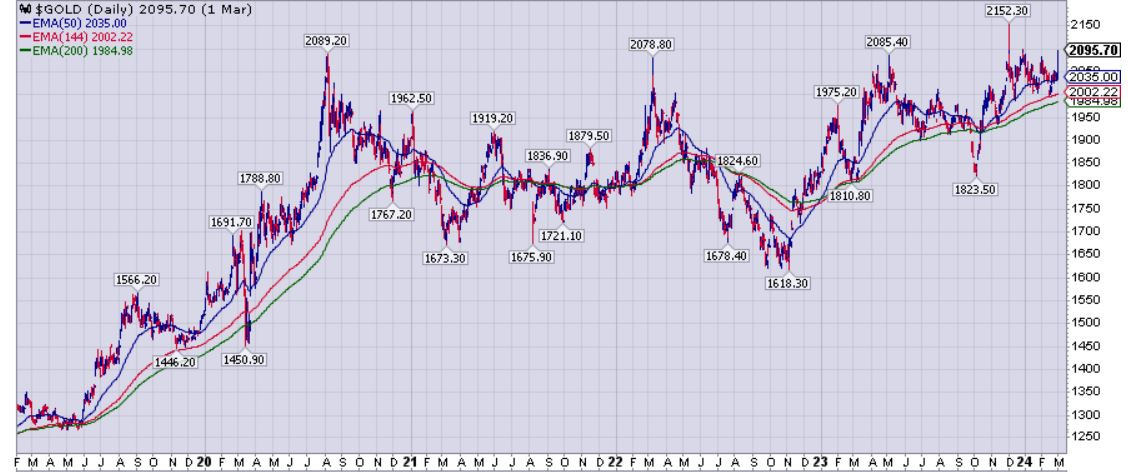
Well fast-forward to gold’s $2095.70 close last week on Friday, March 1st, 2024. Yep, that’s right, it was yet again, another all-time daily and weekly closing high for the yellow metal. (notice a pattern here?) Again, this is definitive bull market action. Yet even despite this reality, some folks still would not call it a bull market, for fear these price levels could be quickly reversed. That wouldn’t matter even if it was quickly reversed, because a market making new all-time highs on the daily and weekly is in a freakin’ bull market. As the saying goes, “a bull market climbs the wall of worry.”
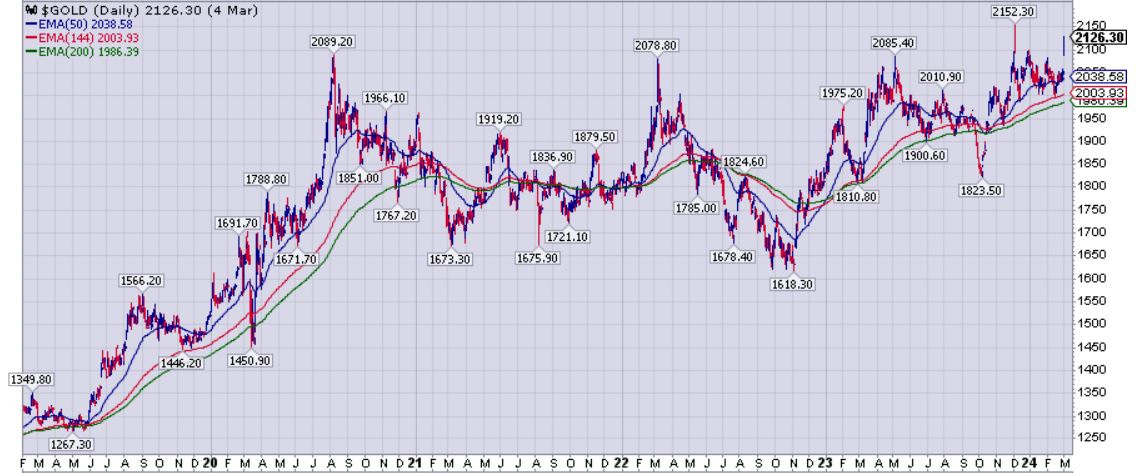
While many could see gold breaking out, the narrative, at least with some market participants, had now shifted to the notion that for gold to be in a bull market, they needed to see a decisive close above $2100 (which is an arbitrary round number to begin with, but possibly a psychological number). Well, then here comes Monday March 4th, with a daily close decisively above $2100, at $2126.30. What more do people want before they’ll finally concede that gold is a new bull leg?
I kicked off this week over at the KE Report on Monday, interviewing my friend and very sharp investor, John Rubino. We discussed the fact that gold was finally going to be closing above $2100 and was finally breaking out. He had a lot of great insights about why gold was breaking out fundamentally. It’s worth getting his insights on what has been and still is driving this move higher for those that may have missed this discussion.
John Rubino – Was Gold Closing Above $2100 Today The Breakout Move We’ve All Be Waiting For?
Interestingly though, when I interviewed my pal and savvy trader, Sean Brodrick, contributing analyst to Weiss Ratings Daily, over at the KE Report the very next day on Tuesday March 5th, he still wasn’t convinced gold was breaking out. I had kicked off the interview with the supposition that we’d seen gold finally in breakout mode, but was honestly a bit surprised that during our discussion he outlined that he was not counting gold as truly breaking out yet, at that time.
His position was that until we saw that overnight high from Asia (from the first Sunday in December) taken out first on a closing basis above $2152.30, that gold had not yet broken out. (I thought most people didn’t think that intra-night high in Asia even counted? Apparently though, now that level now needed to be eclipsed for gold to truly break out.)
Sean Brodrick – Investing Outlook On Gold Stocks, AI Stocks, Defense, Cybersecurity, And Oil Stocks
OK. Well, let’s just review where gold closed this last week, and see if it hasn’t just done everything people have been clamoring for and more…
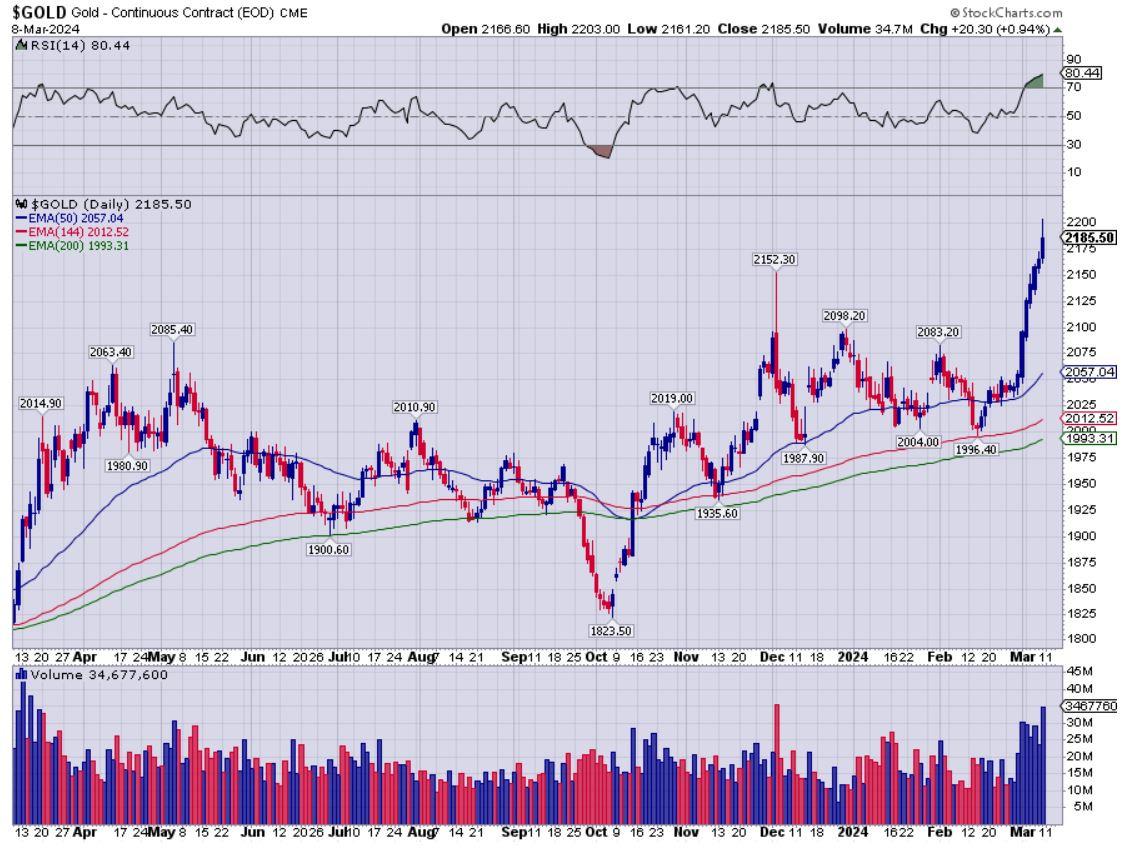
So looking at the chart above, gold painted the tape to a new all-time daily and weekly closing high (once again) to $2185.50 on Friday March 8th, 2024. This is decisively above $2100 at this point as it has been all week long, day after day, and it has now clearly put in a weekly close above the $2152.30 level from December 3rd/4th to boot.
>> Can we all finally admit that gold is and has been in a bull market now?
Most of us can, and when speaking with my buddy Craig Hemke, Founder of the TF Metals Report, over at the KE Report later this week, he offered us up some of the other fundamental reasons that gold was breaking out. There were some different factors included that John Rubino had not mentioned, but when you add the research of both of these guys together, there really are a lot of tailwinds behind the recent price appreciation in gold.
Craig Hemke – What Is Driving This Breakout In Gold, Silver, And PM Stocks?
So wrapping up this week, on Friday afternoon, with gold up near $2200 (actually hitting $2202.35 intraday), I thought we were all singing from the same song sheet finally, that gold had definitely broken out. Then one of the sharpest guys I know in the PM space, friend and colleague Dave Erfle, Founder and Editor of the Junior Mining Junky, threw in one more requirement for gold to truly be in a breakout - a monthly close above $2100.
When will it ever be enough for people? (only kidding Dave. Haha!)
Dave Erfle – As Gold Breaks Out, Buying Gold Stocks On Pullbacks Using A Bull Market Playbook
Bottom Line: The fact that gold broke out to new daily/weekly high at $2089.70 few months back on December 1st was the first tell that a breakout had occurred. I’d submit that with December 2023 already closing with the highest monthly, quarterly, and annual close ever in human history, that it was signal enough that the next leg of the bull market was on. Then we had another daily/weekly closing high on March 1st at $2095.70, then daily closes above $2100 all this week, and then again the all-time highest daily/weekly close yesterday on March 8th at $2185.50. Also note the higher volume on this recent blast higher in the yellow metal. That is an official gold breakout folks any way you look at it.
Dave is a very smart guy though, and he’s probably right that for many of the generalist investors, they are going to want to see that monthly close above $2100 eventually, for a confirming factor and for buying momentum to come into the sector.
He is also correct to point out that on the charts now, gold is getting pretty overbought (note the RSI at 80.44 on the chart above). It is likely that we’ll need to see a corrective move to backfill this blistering move higher in the yellow metal in the week(s) to come. This corrective move will likely present another chance for investors wanting to finish getting into position in their favorite gold mining stocks one more opportunity to buy the dip.
To wrap us up this week, let’s have a listen to my pal Christopher Aaron, Founder of iGold Advisor and Senior Editor over at the Gold Eagle website. He also can see that we may need to have a corrective move to test the breakout level in gold, but then sees a very nice move up to a target of $2535 (and potentially higher if it overshoots). That type of move in the yellow metal, should also mean that silver and the PM mining stocks eventually put on their dancing shoes.
Christopher Aaron – How High Could This Next Leg Of The Bull Market In Gold Go?
Thanks for reading and listening. Wishing everyone prosperity in their trading and in life.
Ever Upward!
- Shad