
The Precious Metals Complex Explodes Off The Blocks In The Seasonal Q1 Run
Excelsior Prosperity w/ Shad Marquitz (Written late on 01-12-2026)

We are back with another breakdown of the precious metals complex kicking off the second full trading week of January. Gold and silver continue to blast higher, building on the strength they’ve seen throughout December, and the PM mining stocks have also been coming along for the ride, albeit in a more muted response than many would expect.
The early part of a new year is seasonally one of the strongest periods of time for the precious metals complex, over the last couple decades. We often see this sector make a strong upwards move coming out of the holiday season and end-of-year book-squaring, and then gain upward momentum into the first quarter of the year during January and February in what has been dubbed the Q1 Run.
It is a good time to review the price action on the charts and developments with gold, silver, and the mining stocks in light of this seasonality, and then map out a course for what could be in store in the weeks and month ahead.
So, let’s get into it…
Kicking things off with a look at the price action today on Monday January 12th, we witnessed that new all-time highs were tagged on the daily gold and silver futures price charts. These precious metals markets have continued to run red hot the last couple of months, ever since the last short-term trough in early November.
Gold: 1-year daily futures price chart:
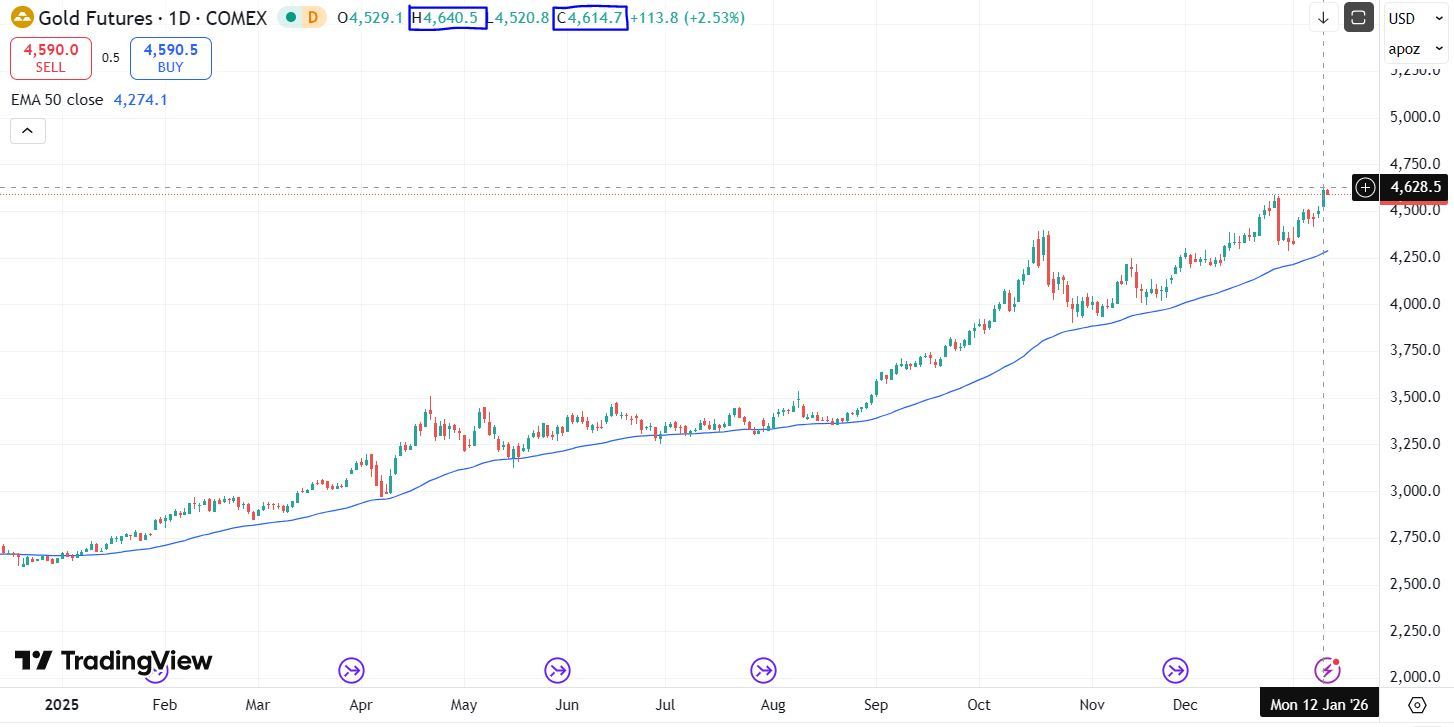
The Gold futures price tagged a new intra-day all-time high at $4,640.50 on Monday January 12th. All new all-time highs are significant and worth noting.
Gold made a new all-time closing high at $4,614.70 on Monday January 12th, definitively closing above the $4,600 round psychological number.
It appears that PM prices are rolling over some in after-hours and overseas trading, but the highwater marks have now been etched onto the price charts, at a seasonally strong time of year when gold’s tendency is to make a move higher anyway (regardless of recent noise and news of what happened with Fed Chairman Jerome Powell’s criminal investigation or changes in home mortgages or the endless currents in geopolitics).
There isn’t much new to say technically about gold, because it has remained in a strong bullish uptrend for the last few years, and its chart has remained a thing of beauty. Until something significant changes, and until pricing quits making a series of continuous all-time highs on the daily, weekly, monthly, quarterly and annual charts, then investors just need to “Let the trend be your friend.”
People have been calling for big corrections all the way up, ever since the $2100 level was eclipsed and beyond… Sure, there have been pullbacks and consolidations along they way, but they’ve been orderly periods of base building that then resolved into breakouts to even higher levels. That is just solid bull market action… Enough said.
Now let’s have a look at the Gold stocks by way of a GDXJ daily chart:
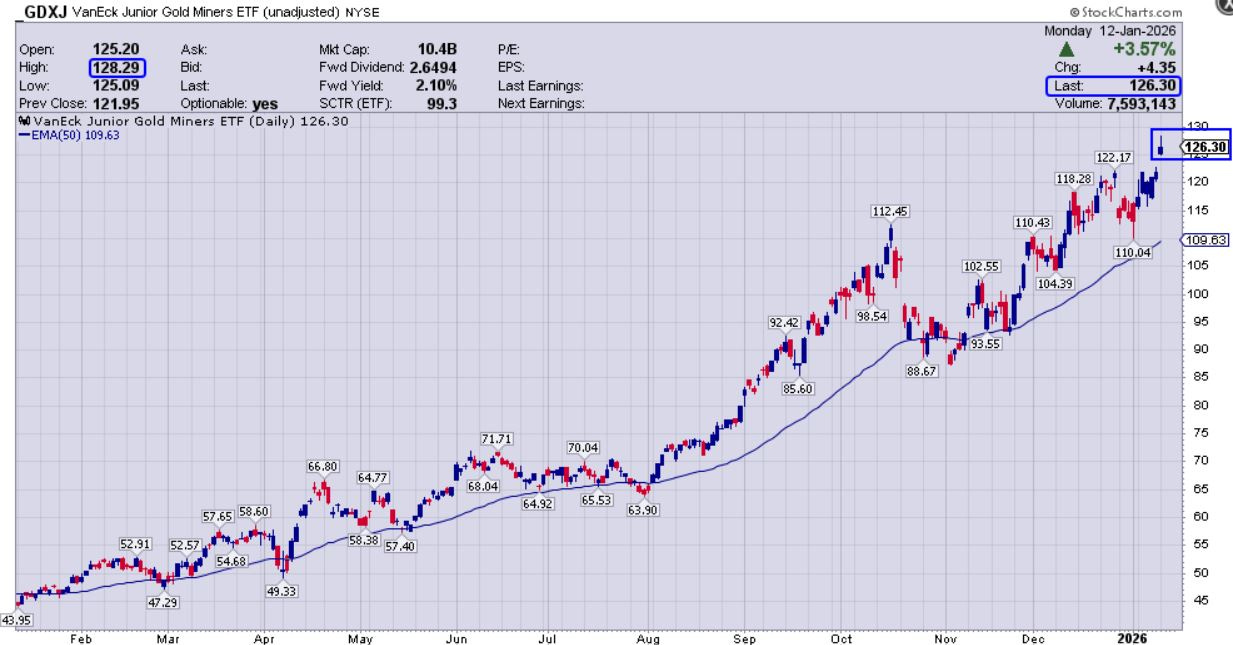
(GDXJ) tagged a new 14-year intraday high at $128.29 on Monday January 12th. All new highs are significant and worth noting.
(GDXJ) made a new 14-year closing high at $126.30 on Monday January 12th, definitively closing above the December peaks in a true impulsive move to higher levels.
Having said all that…. (GDXJ) is STILL nowhere close to the December 2010 all-time intraday high of $179.44. This is despite the gold price being 2.8X as high today as back then, and producer margins are roughly 3+ times higher now than back then. Sector apologists try and explain this all away using inflation-adjusted terms, but that hardly squares this circle. Something else regarding the fundamental undervaluation multiples is going on in both the junior gold and silver stocks during this PM bull market… but they are at least responding higher on their respective price charts.
Not only was silver far stronger than most expected throughout the month of December, but it came into 2026 powered by rocket fuel, and has continued surging to even higher price levels all this month.
Note the strong price action on the silver futures daily chart below:
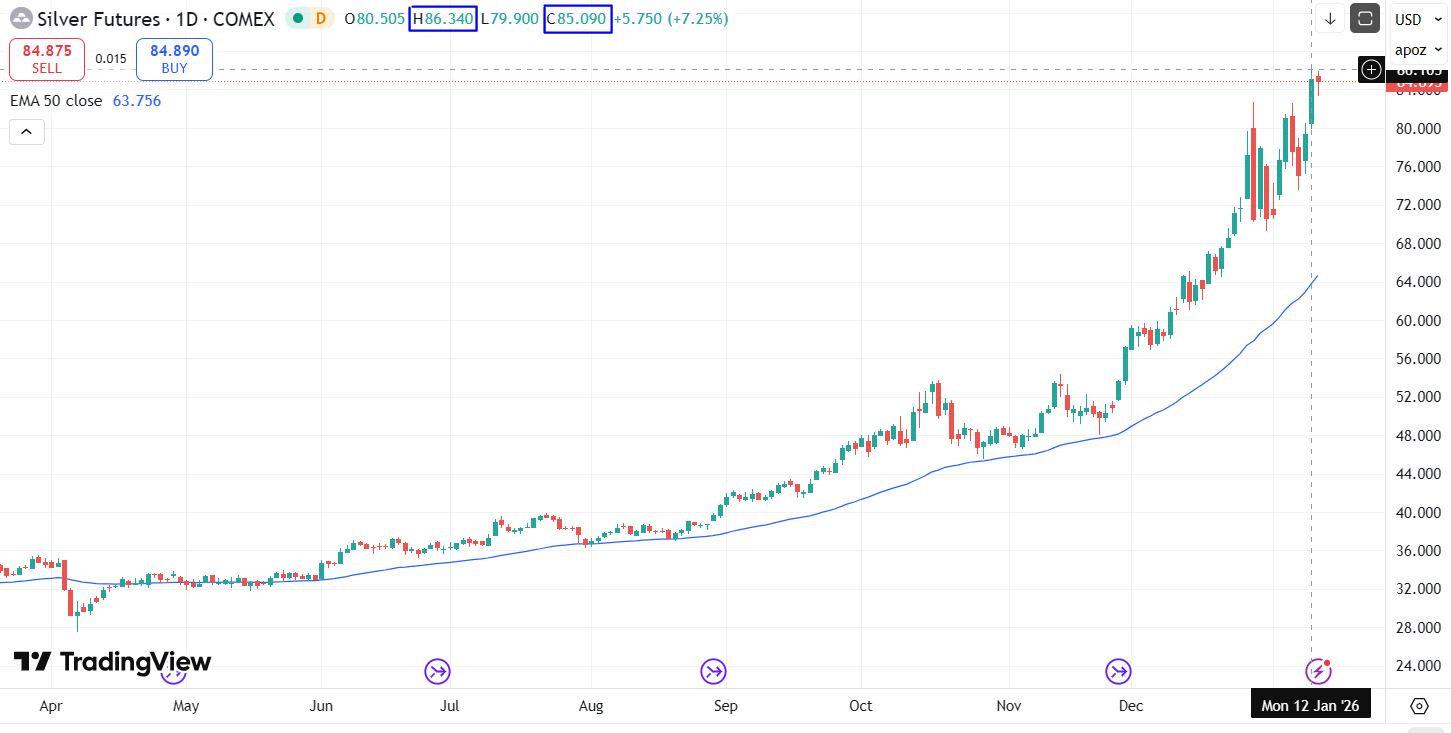
The Silver futures price tagged a new intra-day high at $86.34 on Monday January 12th. All new all-time highs are significant and worth noting.
The Silver futures price made a new all-time closing high at $85.09 on Monday January 12th. This continues the bullish trend that silver has been in for the last few months; nearly doubling in price at this point since the recent short-term low it tagged on Tuesday October 28th at $45.51.
The debate continues to wage online, as to where the silver price will top out, at least on an intermediate term basis; after most analysts consider it to have been moving in a parabolic fashion all of December and all of January thus far.
All of the market adages are being applied:
“Nothing goes up in a strait line…” “Trees don’t grow to the sky…” “Things can stay overbought in a bull market longer than most expect….” etc... etc…
They are conversely being countered with comments from some analysts on the other side of the debate that contend that “Silver is experiencing a new reality…” or “Silver won’t stop climbing until it is well into the triple digits.”
The reality is that NOBODY KNOWS!
It is worth noting that the RSI is actually LESS overbought at today’s ATH price level (currently a reading of near 67), than where the RSI indicator had reached in late December (up over 80). This means strength and momentum indicators are starting to digest these higher price levels.
Yes, of course, the pricing is still really stretched above the 50-day Exponential Moving Average (EMA), currently at $63.75 [shown on the blue squiggly line above]. However, pricing has already been stretched above this level ever since it tested it back in late November, and that has not impeded the price climbing to even higher and higher levels.
The 50-day EMA is also sloping up at a much higher angle of ascent, which demonstrates a raging bull market in price action ascent. Yes, it is an inevitable eventuality that the silver price will return to test that level at one point in the future, but nobody knows when or at what level the 50-day EMA will have climbed to by that point. {Still, it would be irresponsible not to note the extreme price action.}
All we can say at this point regarding the silver price, is that those rocketship emojis on social media or resource stock chat boards have not been misplaced over the last 6 weeks…
I’ve stated here a few times now that the price level I’m watching for personally, before pruning the hedges a bit more aggressively in my portfolio of silver equities, is that 45-year cup and handle upside projection to $96. It is possible that the silver price will overshoot that target, and go up to test triple-digits above the round $100 level, but between $96-$102 I’ll be pulling some winning chips off the casino table.
SIL had a technically significant day to start off this week:
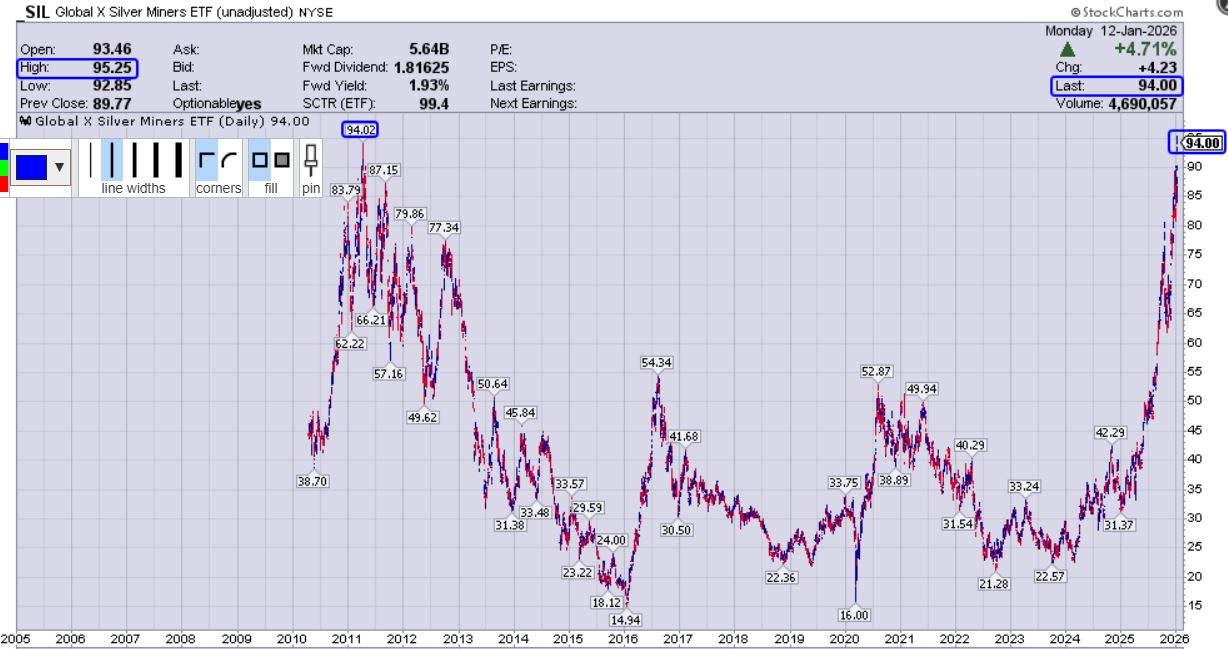
(SIL) tagged a new intraday all-time high at $95.225 on Monday January 12th. All new all-time highs are significant and worth noting. All it took was $86 silver!
(SIL) made a new all-time closing high at $94.00 on Monday January 12th, which was just $0.02 shy of closing above the prior intraday peak of $94.02, and is quite interesting how close those levels are on the chart.
Just for reference, that prior ATH intraday high at $94.02 occurred on April 1st, 2011; but the closing high that day was only $85.24.
This continues the bullish trend in the silver stocks, but I’ll point out once again that silver stocks are still lagging the move in the underlying metal. While it is very nice for our portfolios to witness the (SIL) up 4.71% on the day, the silver price closed up 7.25% on the day.
One would expect to see more oomph from these silver stocks up at least double that at 14%-%15%, as their margins are expanding at a faster level than just the percentage move in the silver price.
If it was just one day like this we could shrug it off as an anomaly, but we’ve pointed out over and over again in December and January where silver was having a high single-digit blast higher, all while silver stocks vastly underperformed or sometimes sold off on the news.
At this point underperformance of the silver producers and developers relative to their expanding economics has become the trend lately.
Tuesday Jan 13th UPDATE on SIL and the silver stocks:
If people think I’ve been a bit harsh lately on the silver stocks underperformance, then let me draw your attention back to this SIL:Silver ratio chart:
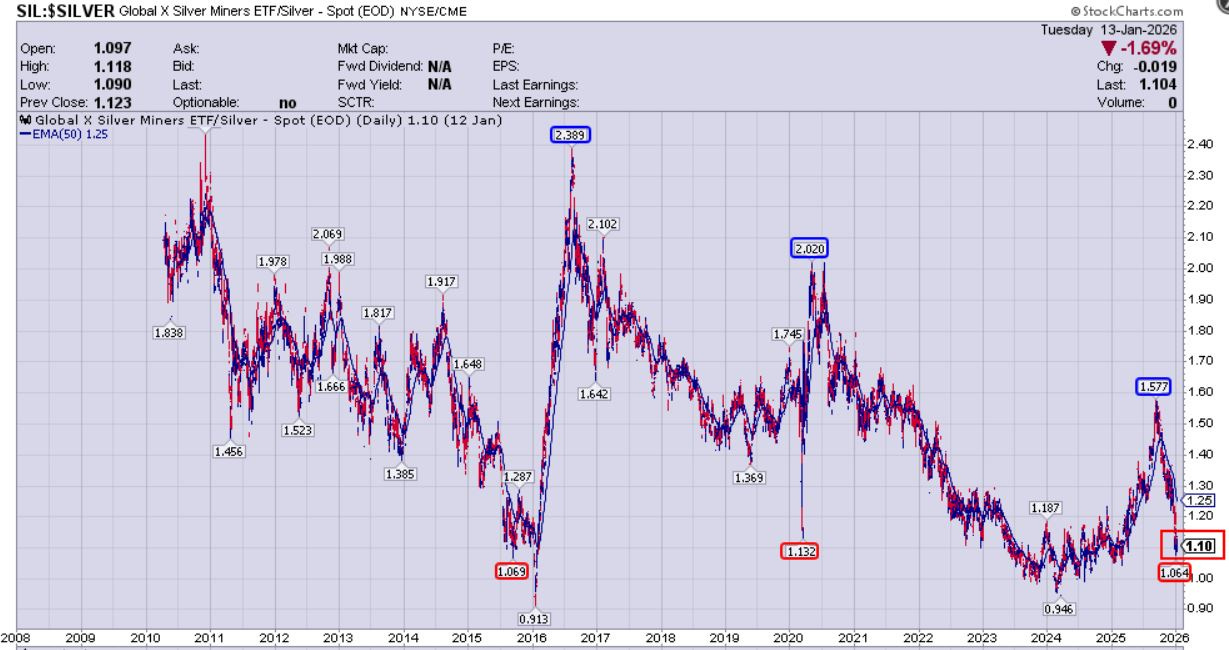
It is totally crazy that the (SIL) ETF has underperformed the move in Silver to such a degree that it is back down near the 2015 Major low in precious metals and the 2020 pandemic crash low, where one ounce of silver almost buys one share of SIL.
Considering how much these producers margins are expanding at these record high silver prices, the silver equities should just be ripping higher on a 2:1 or 3:1 ratio, and yet over the last couple months the equities have actually been falling further behind the moves higher in the underlying metals price.
I don’t believe most investors are looking at the silver stocks objectively, through this lens of valuation relative to the moves in the metal. Instead many drive-by investors are just mesmerized that their stocks are actually in the green and moving higher. Sure, it is nice to see green on the screen and portfolio stocks going higher, but if they really understood the value disconnect going on here they’d be a bit concerned about this overall lackluster performance
In full disclosure, on last Friday January 9th, I did reduce down just a handful of silver, gold, and copper positions that have made huge moves by roughly 3%-7% each, just to engage in some ‘micro-trading’ and to satiate my desire to harvest at least some gains on the way up. It puts the mind and wallet at ease, but didn’t radically change the overall weighting to PM stocks in the portfolio.
I occasionally trim to limit position-sizing weightings, from increasing beyond the portfolio percentage exposure that is desired in each equity.
For example, if a producer pops up to 6%-8% of my overall portfolio in extreme outperformance, then I’ll chop it back down under a 5% weighting.
If an explorer blasts up to 4%-5% of the whole portfolio, then I’ll chop it back down to a 1%-2% weighting.
{That’s just my process and I’m only sharing that for entertainment purposes. What is your process?}
Additionally, I also do micro-trading and trimming in tiny tranches, of the most overbought or biggest runners inside my portfolio, to keep my cash position in the trading account to about 6%-10%. As the whole account grows perpetually larger, it becomes increasingly difficult to maintain those cash position percentages without trimming back some of the stellar gainers.
Please put this into its proper context though: I still left the majority of the core position in place, even for the ones I trimmed back a little bit, and most of the PM positions haven’t been trimmed at all, or at least not since back in mid to late October.
In some PM positions there has been no trimming at all, and only buying on weakness, throughout this most recent intermediate wave of the cycle that started back in the Fall of 2022.
At one point everyone has to make a trade to close part or all of a position, so in reality everyone is a trader… all that differs is their time frames.
For clarity, when I’m discussing trimming back positions by 3% or 5% or 7% or 10%, this is NOT nearly as extreme as the systems some traders utilize like “Selling half on a double” or “selling 1/3 of a winning position on a triple” to take the initial investment capital off the table and “play with the house’s money.”
Personally, I don’t see it that way… the whole position is actually “my money” not the “house’s money” and I want to magnify that capital in the best way possible in the stocks I’ve already vetted.
I understand that aforementioned process some folks employ of selling half on a double, is designed to mitigate risk, but it is too extreme and likewise it limits future gains in raging bull market and much of the potential upside. Your portfolio is not going to consistently outperform the indexes if you take half the position down on a mere doubling.
As the saying goes: “If you’ve stayed around for all the pain, make sure to stay around for all the gain.”
That does not mean to overstay one’s welcome, or to completely ignore a shifting bearish market pattern, but there is no real need to sell half on a double when the bull is charging full-on. Maybe consider starting with selling 5% or 7% or 10% and then reassess how things are developing…
If an emergency downdraft forms, then you can always sell more of the position at a later date, and it will likely be at a much higher level than if you had sold half on a double or even 1/3 of the initial position on a triple.
Granted, sometimes even selling 5%-10% will sting in hindsight during a strong bull markets. For example, all of those positions I just trimmed back by a tiny amount late on Friday did continue to move up even higher today in the continued blast higher. Sure, it would have been better to have left the whole positions in place, but nobody knows the future (or that Silver would blast up over $86 today).
I don’t regret periodically pulling profits and maintaining a 6%-10% cash position in dry powder (even if the position keeps going higher afterwards), because it is part of a disciplined approach to portfolio management. Everyone should have some process around mitigating risk in their portfolio, and for taking profits along the journey.
Conversely, we do see overly-confident or downright cocky market participants that rip on anyone for daring to trim or take profits at all. That is a very unwise takeaway or disposition to have, if one wants to make money over the long-haul.
Some people do literally have the motto “Never sell!!”
However, that viewpoint is totally nuts! You have to sell at one point. It is much better to sell a partial position for a profit today, than to do a round trip back down, or worse to sell a position that was in the money much later for a loss.
Those people that never take any profits off the table WILL become the proverbial BAGHOLDERS at big downturns in the sector.
We see this type of bravado all the time in many sectors that are running (cryptos, cannabis stocks, space stocks, AI stocks, and resource stocks alike).
When Bitcoin is at $126,000 “Never Sell!!”, but then when Bitcoin dropped to $80,000 a few months later then it is suddenly “Radio silence…”
Those vocal bulls proclaim themselves to be ‘true believers’ with ‘diamond hands’ and that they are HODL’ers (HODL = Hold On for Deal Life).
The truth is that all really volatile markets will make tops, and then they’ll put in gut-wrenching drops. If you haven’t taken some winnings along the way, then it is quite painful to watch one’s entire paper gains get erased in waterfall declines and fishing-line sell-offs. Then out come all those “woulda-coulda-shoulda” statements… which are really humans voicing REGRET.
Those diamond-handed HODL’ers are always quiet as a church mouse during the big selloffs, because they, like most everyone else, have started panic-selling at much lower levels as they RFDL (Run For Dear Life).
As an overall bull-market trading strategy: I’ve basically been trying to sit on my hands and not take much action or overtrade these bull markets, mostly just letting my winners keep running.
Having a realistic grasp on how markets work, paired with prudent risk management protocols, means that there have been some PM stock gains harvested along the way though. This gives traders the ‘dry powder’ to deploy into future corrective moves, or to rotate into opportunities in other commodities or sectors.
We saw this back in late September through early October when taking gains was routinely ridiculed. However that dry powder was able to be deployed right back into those stocks in mid-November onwards, at much lower levels (sometimes 20%-40% lower levels), to ride this next leg back up higher again.
One technique I’ve used on a number of the really big up days in the PM markets the last couple months, is to not even open or look at my portfolio positions until after the general session’s trading has already completed for the day (to avoid the temptation to cut bait too early in these moves). That sounds ridiculous… but it does work!
It is more important than ever to truly “Know thyself.” As a result, I didn’t even look at my portfolio today until 10 minutes after the market close, to keep myself from getting out the hedge clippers too early… 😊
When one can calmly review the charts and fundamental factors in the afternoon and evening, then they can decide in advance what to execute on the following day, using dispassionate ‘limit orders’ based on a set price in advance. Quite often the takeaway will actually be to just hold, taking no action.
My propensity has always been to be an early trimmer (which did actually help me preserve profits better than many during the bear market rallies in prior years).
However, in a raging bull market, the best thing one can do is to take little to no action on big upside breakout moves in pricing. {that isn’t investing advice and may be heresy to some other folks, but I’m just sharing what I’m doing with my own money for entertainment purposes}.
I made a promise to myself years ago that this was a particular area for improvement in my trading, and that I’d do better this cycle by not clipping off my winners too early in the move… and I have done so much better thus far in the face of eye-watering 3X, 5x, 8X, and 10X+ moves at just holding steady, when I just want to reach out and ring the register.
For me personally, that means not staring at all that green-on-the-screen during the main trading session, or else I do get itchy trigger-fingers. Haha!
One other more fundamentally-based consideration is that we are going to see blockbuster Q4 earnings reported in just a few weeks from the gold and silver producers. It still hasn’t sunk in with many investors just how well these companies are doing financially. (Literally, this is the best they’ve EVER done!)
Even if the metals start correcting leading into earnings season, those results are going to shock many analysts and generalists. Some stocks could pop up bigly on their quarterly news, even if the overall sector starts consolidating.
It’s more probable that any sector weakness will be pounced upon by those investors still watching all this from the sidelines, in lieu of the huge earnings potential of the producers, as we’ve moved into Q1, or when reviewing expanding economics in the studies of the PM developers.
So why would I want to sell in a meaningful way until we have a chance to review the quarterly earnings reports?
Isn’t Q1 going to have even higher average metals prices for producers to sell into, and thus even larger record revenues than in Q4? (It would take one heck of a metals selloff to cancel that probability and get the average quarterly pricing below Q4).
Then there is one more factor, we rarely discuss on this channel, but we aren’t totally ignoring it either = SEASONALITY.
Right at the onset here, considering what a charged topic this is, we should start with the obvious point, that no 2 years are identical, and there is a great deal of room for variance and unique fundamentals as many annual processes unfold.
However, just like there are seasonal weather patterns to storms, precipitation metrics, and temperatures… Likewise, in the stock markets there are seasonality patterns, and they have been seriously studied by savvy investors for many decades.
These patterns within various market sectors, are uncanny in how there are identifiable cycles under the surface that tend to wax and wane around the same times when we look at the composite data over many years, superimposing all of that recurring data onto a ‘typical’ calendar year.
We could point to the recurring patterns in pricing around natural gas as it relates to cold weather setting in, the gasoline price as it relates to ‘shoulder season’ or ‘summer driving season,’ or retail stocks as earnings expectations are magnified from the end-of-the-year consumer shopping extravaganza in Q4 into Q1 when their outsized revenues get reported.
Now, over the years, the media has talked up these seasonal patterns to sensationalize them, reporting on prevailing market trends with much hyperbole; which just puts them even that much more on people’s top-of-mind awareness and into the overall investor zeitgeist of that period of time. This creates discernable patterns of market behavior that even get picked up and exploited by computer algorithms and machine trading as background factors; making it a ‘self-fulfilling prophecy.’
To be clear, seasonality is not the root cause for any direct daily price action in and of itself, but it can act as a mild headwind or tailwind. Really, that is how it should be thought of.
This is not a fortune telling gimmick; but rather something to be aware of as a slight influence on a sector, especially during seasonal strength or weakness extremes.
I fully recognize that some investors completely dismiss seasonality, which is totally fine; but it’s merely one of the many arrows to have in one’s trading quiver, for navigating the markets.
To that same point, many also brush off or scoff at T.A. as useless, but they do so to their own detriment longer-term. Again, technical analysis is not for fortune telling either, but it is another tool investors can utilize, just like fundamental analysis, for identifying compelling risk/reward setups for either entries or exits.
There is no way to predict the future, but we can stack the odds in our favor and look for multiple data sets that are overlapping at the same time -- for high-conviction trade setups.
For example, right now for the precious metals we have strong fundamental macroeconomic and geopolitical factors, matched up with strong technical factors on the price charts, and then overlapping with strong seasonality factors on the longer-term charts, all lining up into a perfect bullish storm for the PM sector.
Seasonality in markets is very much like a driver being aware of ‘rush-hour’ traffic on the interstate or around town, or travelers planning ahead for peaks in airlines/airports/rental cars/hotels for ‘holiday travel.’
It really doesn’t matter if they BELIEVE in ‘rush hour’ or ‘peak holiday travel’ philosophically… it’s going to be there as a factor regardless.
They can either plan ahead, knowing those seasonal trends, or they can be simply oblivious to it; but then likewise be quite perplexed by how hectic things are at those times and how pricing on those services spike during those seasonal trends.
Market seasonality is much like that, and these smaller seasons may express themselves differently than the norm on any given year, but these trading patterns that show up rhythmically shouldn’t be totally discarded or ignored either.
For example, we just left the window of time, at year-end, where stocks or sectors that have lagged can experience another wave of selling pressure, in what has been dubbed ‘tax-loss selling season.’
The reason for this season is that investors can book any extreme losses at that time of year, in order to wash out some of their trading gains, and thus avoid paying as much in capital gains taxes.
When investors say in passing that “Tax loss selling wasn’t that bad this year” or conversely “That was a brutal tax loss selling season….” it is almost like they are comparing how bad of a winter it was in contrast to others, or how much rain this spring brought compared to last year. They are comparing results to the mean….
There are also many firms that will close positions in a stock, or ETF, or even an entire sector before or during the quarterly “quadruple witching,” that occurs on the third Friday of March, June, September, and December.
There are plenty of market gyrations before and after these seasonal Quad-Witching events; which often serve as either as the beginning of reversal patterns, or strong continuation patterns in the current trends leading into them.
The December quadruple witching adds even more market friction and noise around the more thinly traded sessions at the end of the calendar year.
Year-end also has industry performance metrics that affect compensation tied to it, in which investment institutions are judged in relation to index benchmarking and against prior years’ performance results.
Then, once trades are locked in for optics on the year, these institutions, along with the hordes of retail investors, get positioned into new equities, ETFs, and sectors during the very last week of the year; or some will wait until the first couple trading sessions of the new year to carry that action over in kind.
This seasonal period, as the annual calendar flips the page, has so much new trading accumulation across the board, fueled by forward-looking optimism on the year to come, that this wave of buying often shows up as a big spike higher in markets, which has been dubbed the ‘Santa Claus rally.’
Then there is the disproportionate weighting that some investors and investment firms give to the notion of the ‘January Effect.’
One older market adage is that “So goes January, so goes the year.”
Personally, I don’t put that much weighting on determining the entire year’s direction solely off the first week or even first month’s trading patterns. Having said that, that doesn’t change my awareness to the point that many others do watch this.
Again, these are all very pervasive market notions, that can still act as a subtle influence in the background of investors consciousness.
According to Investopedia and Wikipedia here are the Causes of the ‘January Effect:’
Tax-Loss Harvesting
Investors often sell losing stocks in December to offset capital gains for tax purposes.
After the New Year, they repurchase these stocks, increasing demand and driving prices up.
Year-End Bonuses
Many investors use their year-end bonuses to buy stocks in January.
This influx of cash can contribute to rising stock prices.
Historical Context
The January Effect was first noted in 1942 by investment banker Sidney Wachtel.
Historically, small-cap stocks have shown a more pronounced January Effect compared to large-cap stocks.
Current Relevance
While the January Effect was more noticeable in the past, its impact has diminished in recent years.
Some analysts argue that the market has adjusted to this phenomenon, making it less reliable for investment strategies.
Then specifically as it relates to the precious metals space, students of seasonality in this sector will note the strength of the first 2 months of the year in January and February in both gold and the precious metals stocks (regardless of newsflow and beginning of the year noise).
This period has been dubbed the ‘Q1 Run,’ and rightly so…
It is then followed by the “PDAC curse” in early March, then the “Spring Fling” heading into early April/May, then the “Summer Doldrums” in June/July, etc…
Now keep in mind, that there will always be years that don’t follow this exact pattern that people can point to and say “Yeah, but not this year or that year….”
[OK, fine, they are seasonal patterns, not destinies carved in stone.]
Just like there are tendencies to seasonal weather patterns or temperatures, where sometimes it’s a warmer than average winter, or there isn’t nearly as much rain in the spring, or the kids have a noticeably hotter or cooler Halloween in their costumes, etc… it’s the same thing with seasonal pricing tendencies.
One can go totally bonkers looking at all the different seasonality tables and charts online.
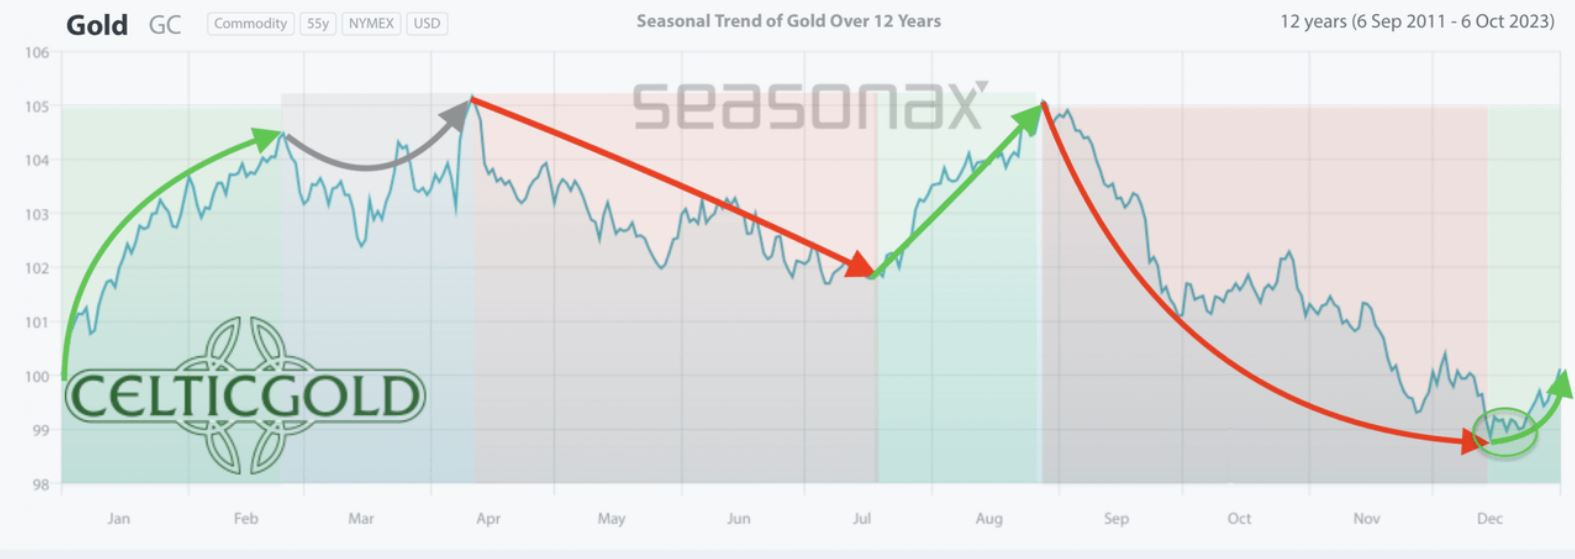
However, as someone that has been trading this sector over the last 16 years, I’d say this Seasonax chart below, of the seasonal trends in gold over the dozen years between 2011 and 2023, pretty much encapsulates the trends we’ve seen most clearly, staring off with big curved green arrow highlighting the ‘Q1 Run.’
Again, not every year perfectly matches this, (but if you overlay all the years into a composite, then these are the trends that emerge as headwinds or tailwinds.)
Below is another multi-decade seasonality chart by Equity Clock, that demonstrates a similar trend as the Seasonax chart above, although, it is over 3 decades and so it highlights a slightly different trend in the fall and year-end pricing action.
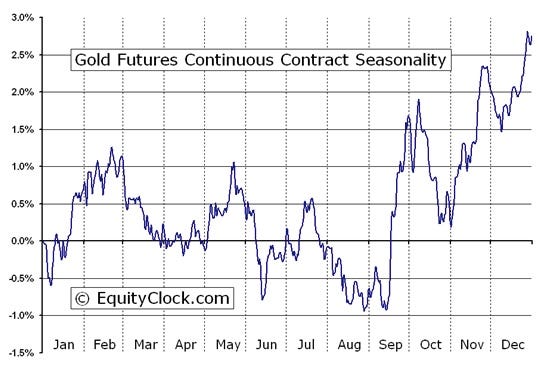
This composite chart compiles many years pricing data, and also highlights the seasonally strong ‘Q1 Run’ in January through February. That is what is germane for the points we’ve been observing on the charts for this article here in mid-January, and for looking ahead to the weeks and month in front of us.
Then from a seasonality perspective many larger institutional capital and fund managers tend to look at the even larger annual and multi-year seasonality and cyclicality of the broad sectors themselves.
A friend and colleague in the resource sector who I really respect is fund manager, Matt Geiger of MJG Capital. Matt sent out an email on Sunday January 11th to his subscribers pointing out how he views the precious metals sector coming into 2026.
“…the world has changed since the January 2025 MJG partnership letter characterized mining equities as “unloved and out of favor”. Due to surging metal prices, mainstream interest in critical minerals, and aggressive pro-mining government intervention, non-traditional mining investors are finally awakening to our niche of the market. This is likely to only accelerate into 2026 as fresh capital -- enticed by last year’s outsized returns relative to most any other asset class -- is drawn to the space, boding well for performance in the near term.”
“With this said, as discussed in this letter’s Market Musings section, there are warning signs that the precious metals trade in particular is getting overheated. This has implications for the entirety of the MJG partnership portfolio and may augur well for our investments focused outside of precious metals.”
To read the official MJG Partnership Letter – January 2026
https://mjgcapital.com/wp-content/uploads/2026/01/January-2026.pdf
It is worth noting that there are plenty of other commodity sectors, with their respective resource stocks running higher lately, where capital flows have been rotating in.
Pull up the charts of copper, (COPX), lithium, (LIT), platinum, or lately even the rebounds in zinc and nickel, and you see sectors in strong uptrends.
To Matt’s point there are good investments across the spectrum of mining stocks to be reviewing and positioning in.
Sean Brodrick, Editor of Wealth Megatrends, Supercycle Investor, Resource Trader, and contributing analyst to Weiss Ratings Daily, joined me last week on January 7th to outline the continuation of a number of investing megatrends that did well in 2025 and are on track to keep outperforming in 2026. We discuss strategies for portfolio management and some of his portfolio trades in gold, silver, copper, uranium, oil, antimony, and next generation defense stocks in drones, rockets, robots, AI, and quantum computing.
Nick Hodge, Co-Owner of Digest Publishing and editor of Foundational Profits and Underground Alpha, joins me for our monthly longer-format discussion on the stew of different macroeconomic factors, continuing to fuel the commodities supercycle in silver, gold, uranium, copper, lithium, and opportunities in their related resource stocks.
Thanks for reading and may you have prosperity in your trading and in life!
Shad