Special Alert – Uranium Stocks Magnetically Drawn To The 50-Day Moving Average
Excelsior Prosperity w/ Shad Marquitz – 02/19/2024
About a week and a half ago, we discussed that the uranium equities were starting to get a bit extended in price, and that it was likely, [at least on a short-term basis], to see them correct back down to their 50-day exponential moving averages (EMA), and then reassess. Well, that 50-day moving average has been an absolute magnet for price, where most of the more established uranium stocks have been drawn back down to it, as anticipated.
As an aside, I read and hear a lot of silly comments about technical analysis, from investors that clearly don’t understand how it is used as a tool, nor what it’s purpose is for pointing to better probabilities in risk/reward setups for entries and exits in trading. The most popular bashes regarding technical analysis, are that “it’s always wrong”, or that “it won’t work in manipulated markets”, or my favorite “it’s just a bunch of colorful squiggly lines on the page and meaningless.”
Well, there is little helping someone that has their mind made up already, and reminds me of the saying “a person convinced against their will, remains an unbeliever still.” The reality is that a mind is like a parachute, and works best when it is open. For those with an open mind, I’d submit that they should pay extra special attention to the blue “squiggly line” on the charts that follow, as it is very easy to see that price in these more liquid uranium stocks are respecting the 50-day EMA.
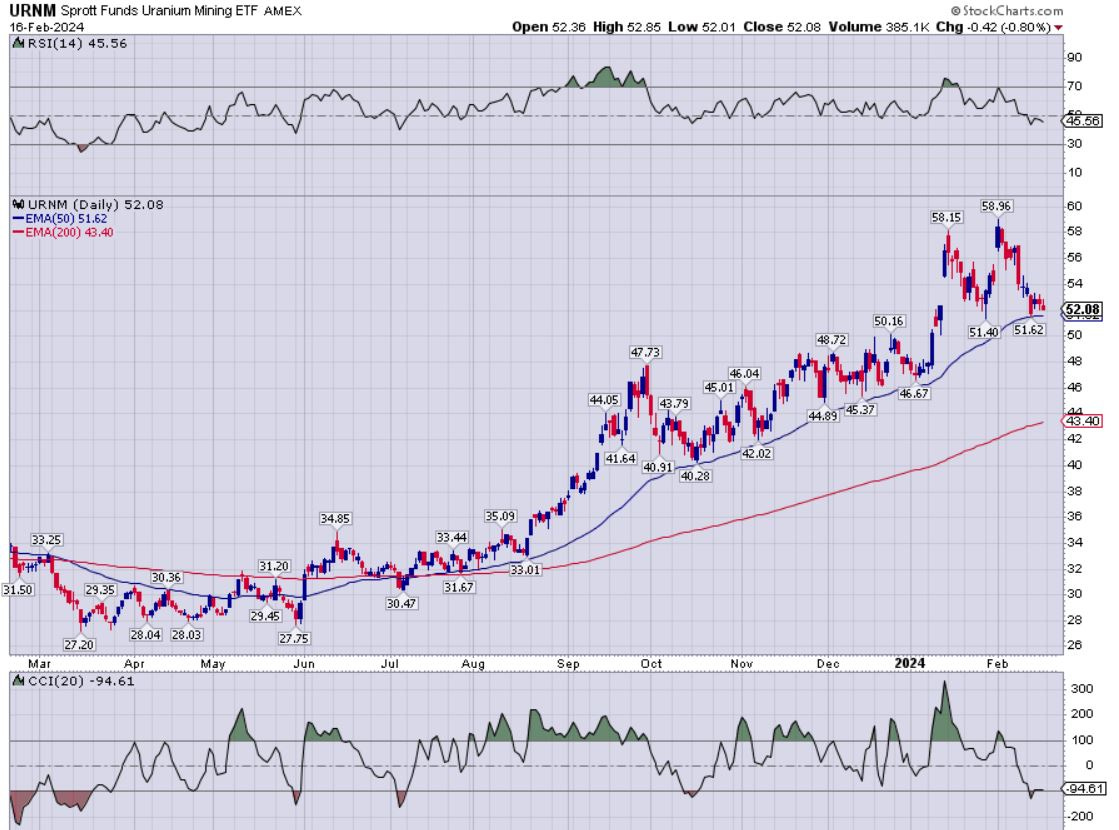
Sprott Funds Uranium Mining ETF (URNM) – Daily Chart:
Note how many times, just over the last year, that the 50-day EMA has been either overhead resistance, or pricing support, that URNM has returned to over and over again. There are too many touch points for this to be “just a coincidence” and again, for thinking people with an open mind, it is illustrative of a market being traded off a widely followed metric. You don’t have to like this point, or even understand it, but savvy traders will just go with it. Rather than resisting this idea and swimming against the current with one’s own beliefs about where prices should be based on subjective notions, why not swim with the current and use this information to one’s advantage?
A couple of weeks back, it was easy to see pricing had gotten too far away from the 50-day EMA, and thus it was time to lighten up on uranium equities. Conversely, now that pricing has approached it again, it becomes simply another probabilistic setup for adding to a position. (This is not investment advice, and everyone should make their own decisions based on their own due diligence and unique risk tolerance and investing parameters.. Stating the obvious, probabilistic doesn’t mean guaranteed, simply that the odds are in one’s favor).
The other thing I’d note on the chart above is the Relative Strength Index (RSI) reading above the chart that was overbought in mid-January (with a reading over 70), and now is below neutral with a reading of 45.56. If it gets below 30 it is considered oversold, so it isn’t there yet, but is looking more enticing. Looking below the chart at the Commodity Channel Index (CCI), at momentum-based oscillator, one can see that it is at negative -94.61, so oversold. Glance back over the other points where the CCI got oversold at negative -100 and lower, it you’ll see it correlated with other lows where the pricing rallied thereafter.
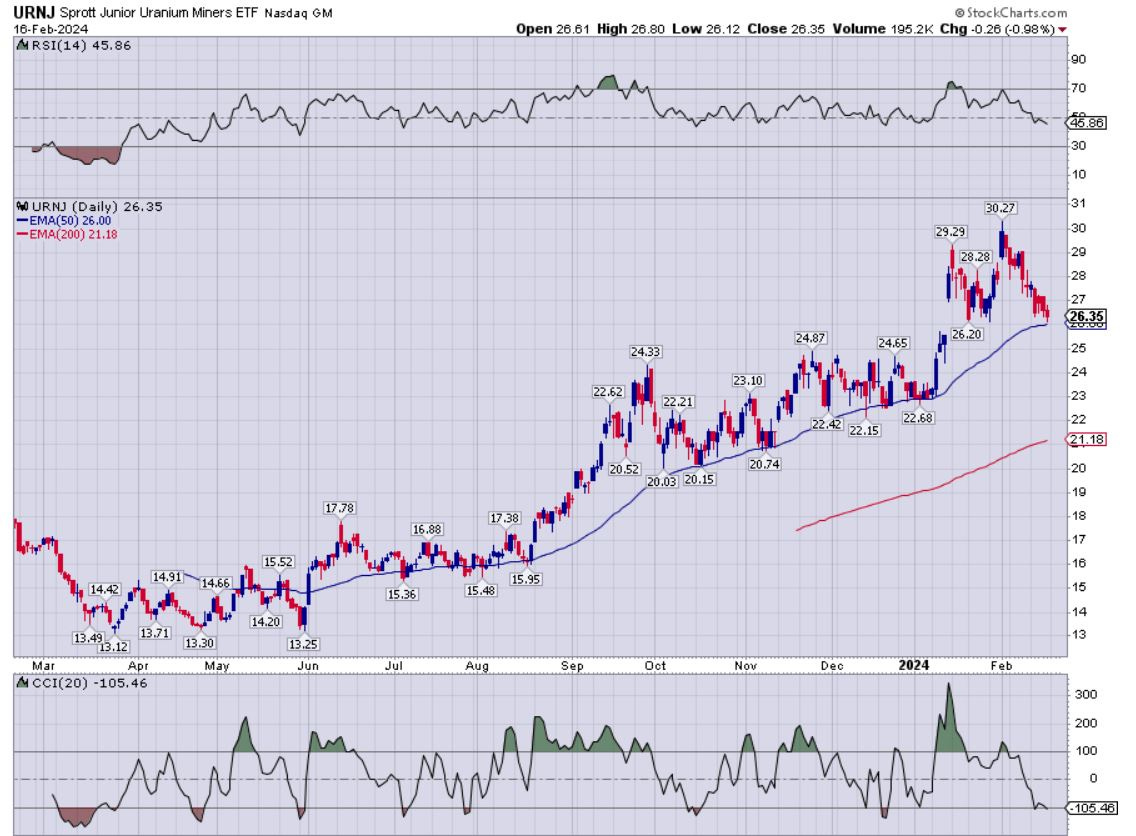
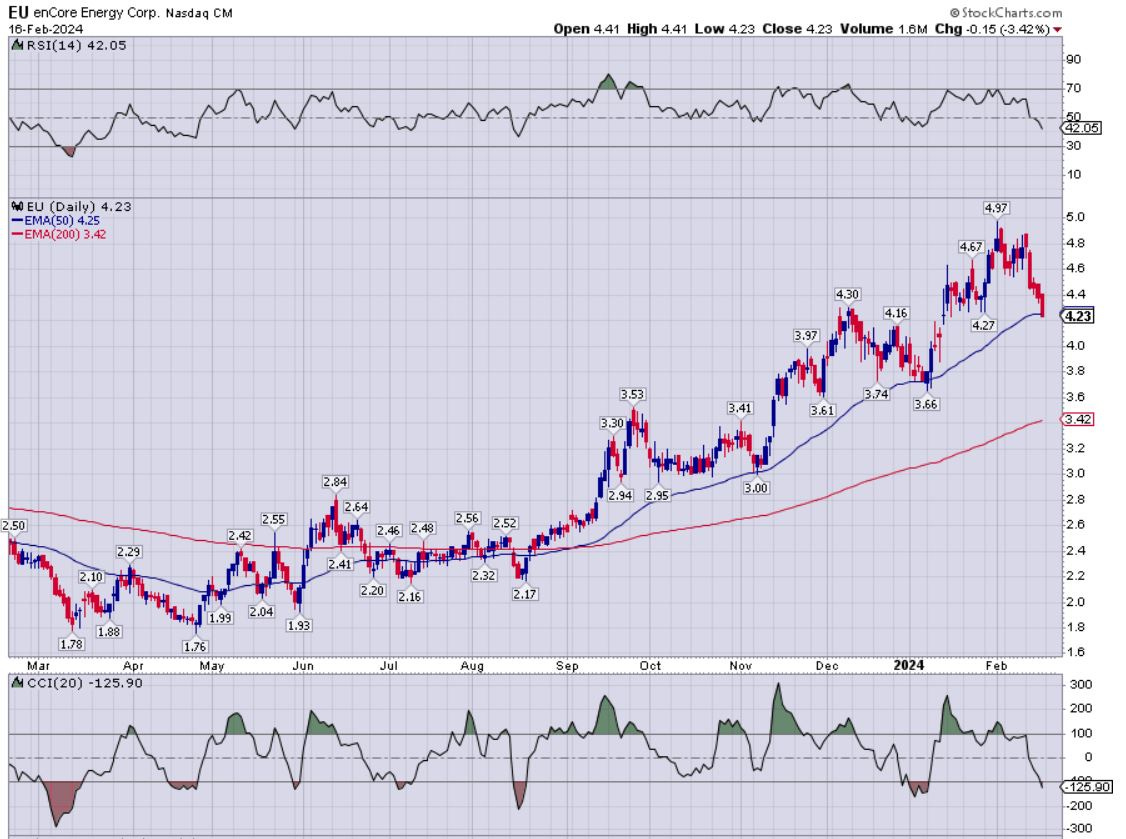
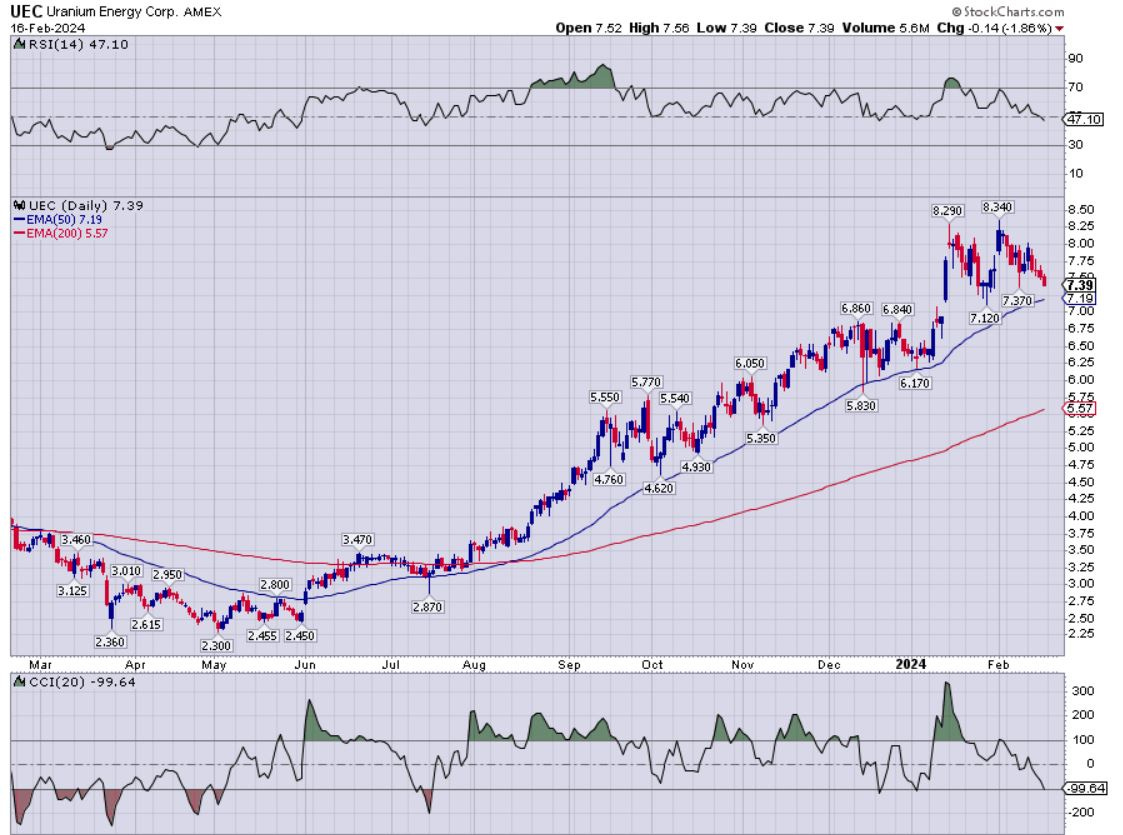
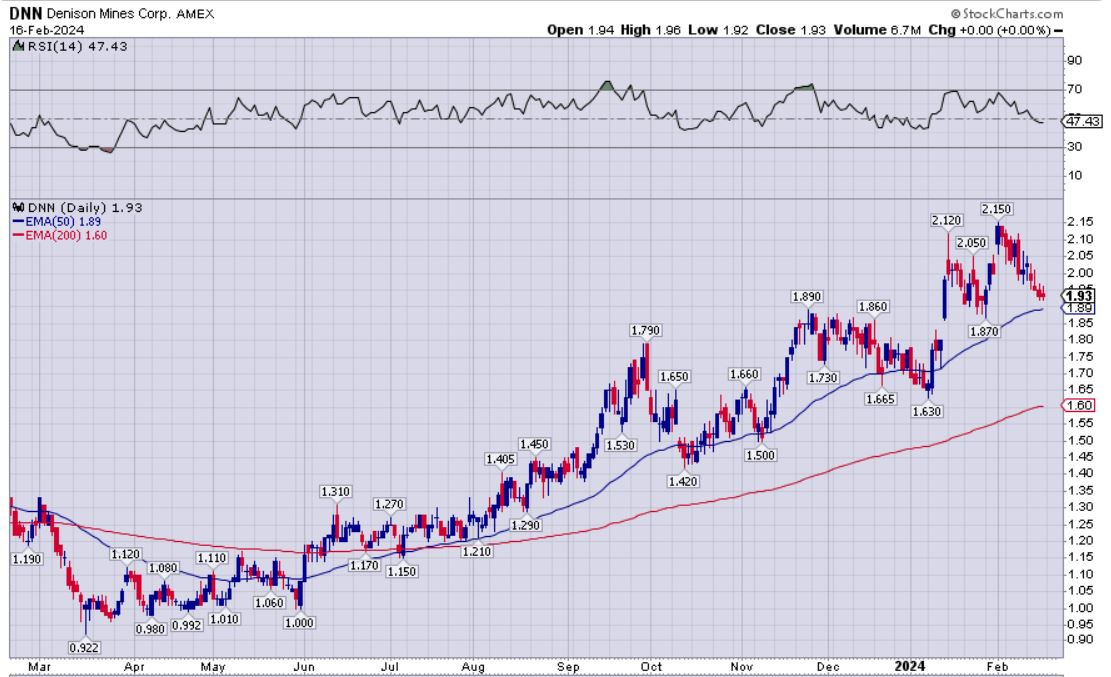
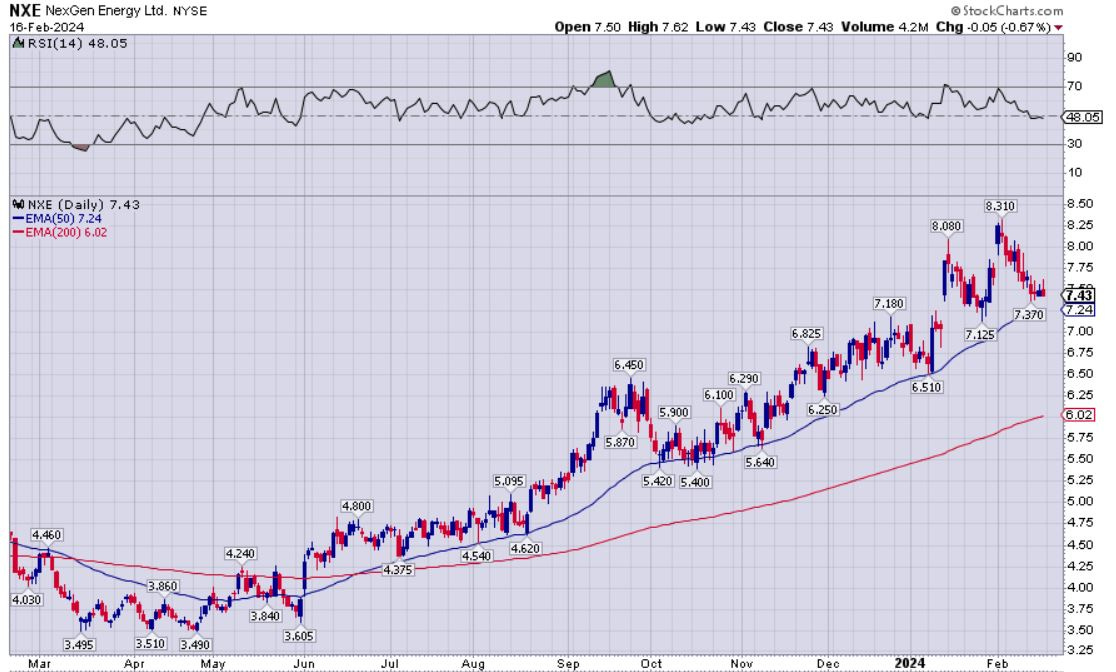
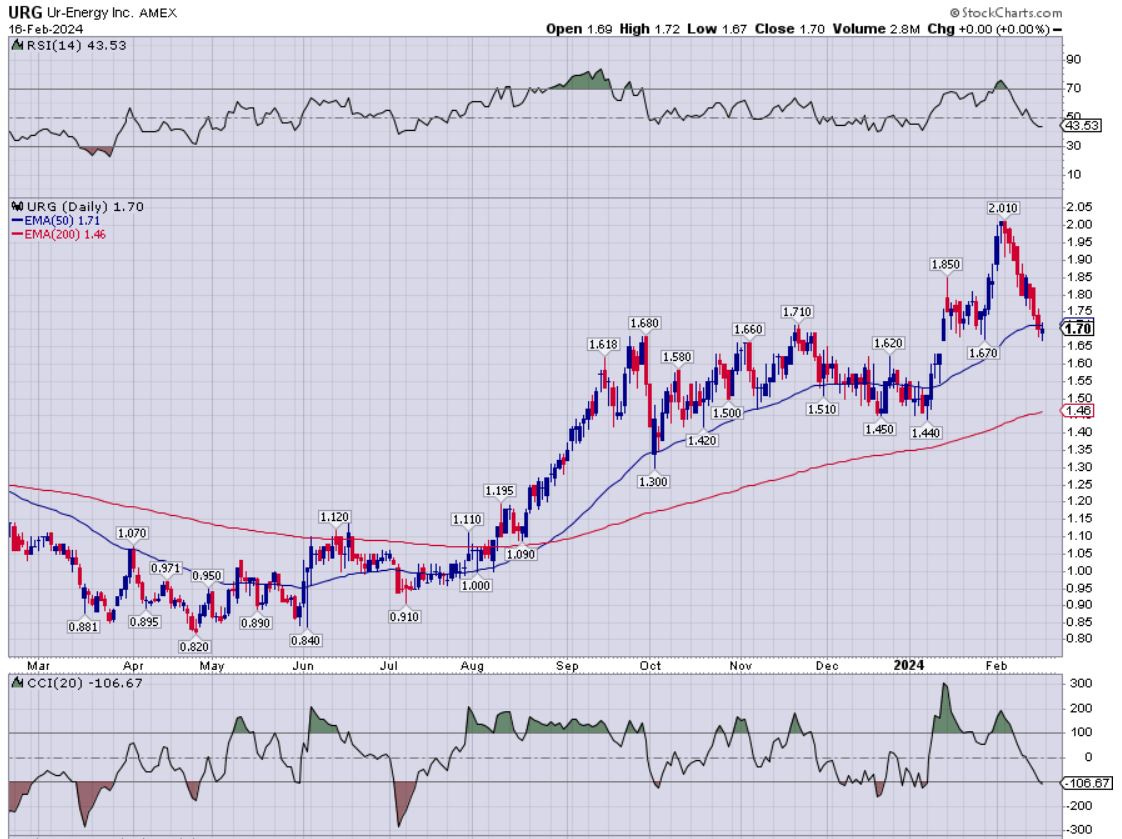
So putting this all together: We have pricing approaching a key support level with the 50-day EMA, paired with a neutral RSI that has been trending lower and cooling off, and with a CCI momentum reading that is oversold. My takeaway, and why I sent out this special alert, is that we may be in an area where we are getting closer to a short-term trend change and pop higher in pricing for URNM. These same exact points could be made on the following individual uranium equity charts. Have a look!
Sprott Junior Uranium Miners ETF (URNJ) – daily chart
enCore Energy Corp (EU) - daily chart
Uranium Energy Corp (UEC) - daily chart:
Denison Mines (DNN) - daily chart
NexGen Energy (NXE) - daily chart
Ur-Energy (URG) - daily chart:
So… Are you picking up a trend and pattern here with regards to uranium stocks and the 50-day EMA?
Now, that doesn’t mean that all these stocks have to necessarily bounce back higher after approaching, or maybe briefly dipping below their 50-day exponential moving averages, or when the CCI is so oversold. This is simply data, facts, and input, to consider when looking at more opportune risk/reward probabilities. It’s just a tool and another “arrow in one’s quiver.”
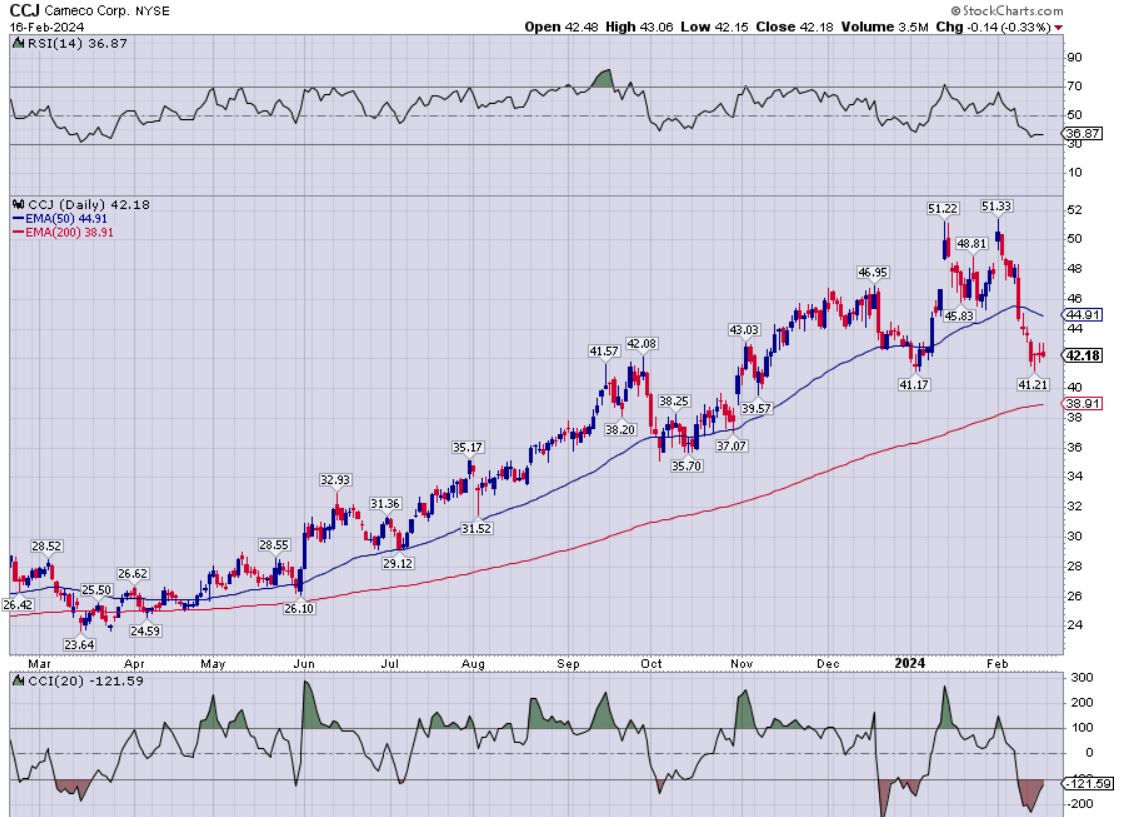
Sometimes a tool will work for a while, until something different changes and overwhelms it. For example, just look at the largest North American uranium producer, Cameco (CCO.TO) (CCJ) as a company that has just sliced right down through it’s 50-day EMA like a hot knife through butter.
This brings to mind the adage, “The trend is your friend… until it isn’t.” So in this case, the Cameco daily pricing was respecting the 50-day EMA for the most part over the last year, with a few small dips below it, but this recent action is a decisive break below it. This will be important to watch, as it could be a canary in the uranium mine for the rest of the sector, if they all follow suit.
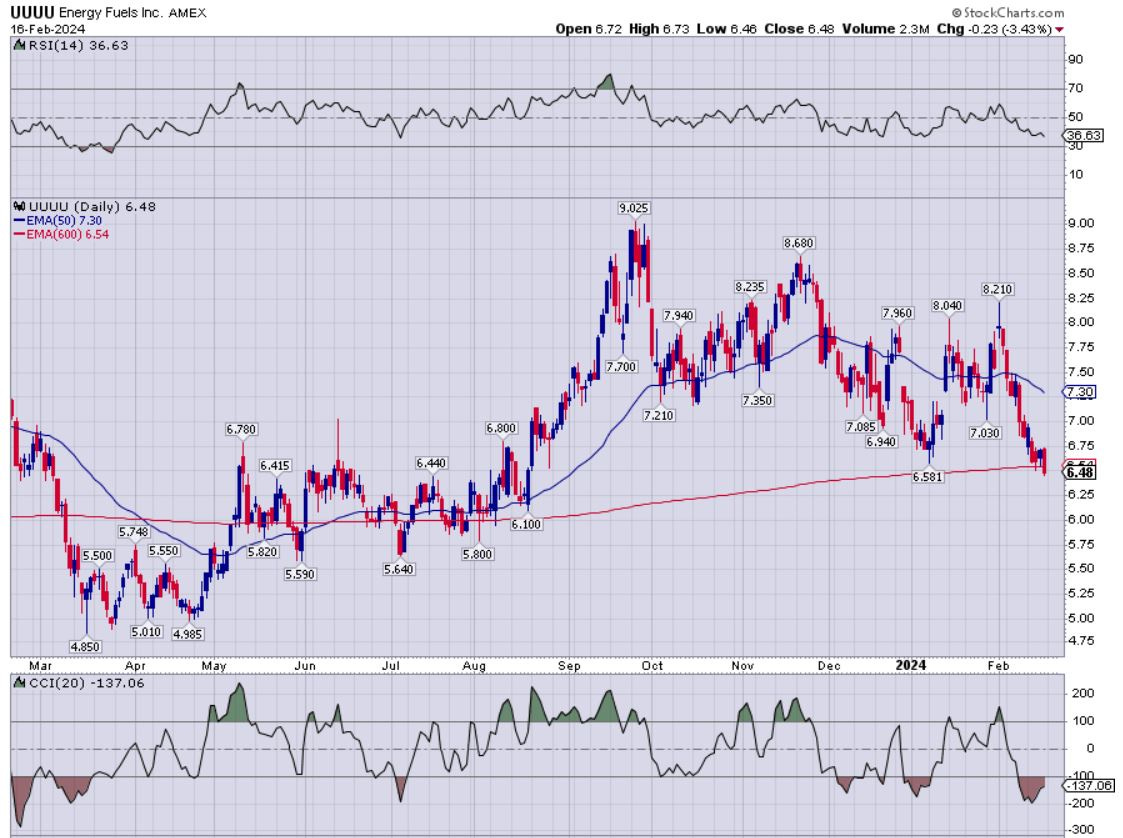
Now let’s take a look at an oddball uranium miner chart = Energy Fuels (EFR.TO) (UUUU):
I really like Energy Fuels as a company for its fundamentals; not just for uranium production, development, and a nice portfolio of pounds in the ground, but also for the other 2 kickers of rare earth processing, and vanadium production. It’s an interesting company for a number of reasons, which we’ll get into another time on a deep dive into the fundamentals. However, for the purpose of this special alert update on uranium equities, it is more of an outlier anomaly in the sector right now.
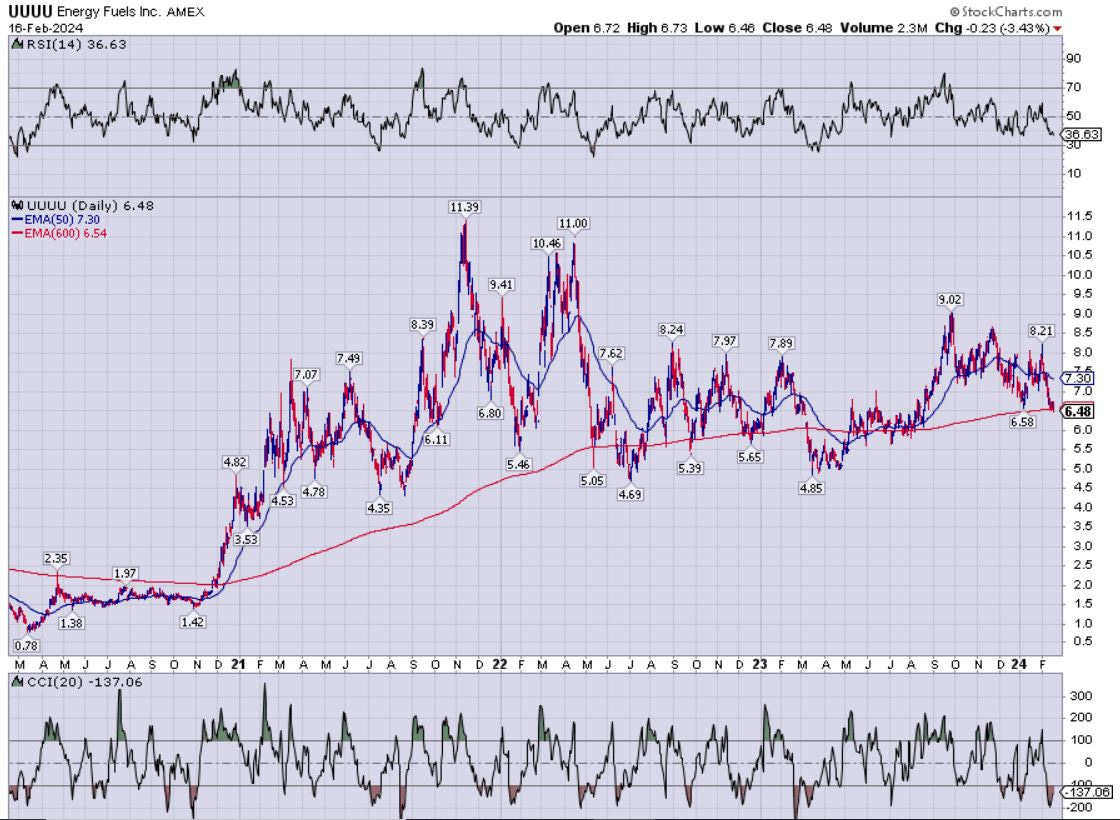
Technically speaking, this is more of a sloppy chart, and UUUU hasn’t been respecting the 50-day EMA like the rest of the sector, and clearly dove down far below it for most of February once again. It may have found some support at the 600-day EMA (unusual), and it is oversold on CCI at -137.06 and close to it on the RSI at 36.63. It’s just a wacky looking technical setup, but these types of situations intrigue me personally, and have me interested in starting to accumulate more shares in Energy Fuels this coming week.
Personally, I sold some of my UUUU shares on (11/22/2023) @ $8.42, and before that had sold another tranche on (09/18/2023) @ $8.63. Pricing closed last Friday at $6.48, substantially below where I pulled some profits, and I may add a bit soon to layer in another tranche at this better level. To be clear, this is definitely risk, because it could just keep plunging, but I like the setup here personally to take a stab at throwing another log on the fire. My thesis is that UUUU will likely be a double-digit price in dollar terms as the uranium bull market matures, (like it was in 2021 and 2022), and that it seems to have more catching up to do than other more established uranium equities in lieu of the higher spot prices, but it being nowhere close to the highs from a couple of years back.
Wrapping up I’ll leave you with an interview we just did over at the KE Report the end of last week with Justin Huhn of Uranium Insider. Justin is one of the more well-informed and prolific public voices in uranium investing space, and it is always a treasure trove of information to get his thoughts on the nuclear fuels and uranium equities universe.
Justin Huhn – Supply And Demand For Nuclear Fuels – Staying Long And Strong Uranium Stocks
Also, I’m adding this in after having already published this article, so only people clicking on the link to see the article will see this, but we also interviewed William Sheriff of enCore Energy last week on the KE Report for a solid company introduction.
Encore Energy – Introduction To A Growth-Oriented Uranium Producer Operating In The USA
As always, the opinions shared in this article and the uranium companies featured that I hold in my personal portfolio, are definitely not investing advice. I’m not recommending any of these for anyone else to purchase, but rather; I’m simply sharing my opinion on how I view the uranium stock sector, and sharing which stocks animate me personally.
Everyone should do their own due diligence, talk to their financial advisors before making any investing decisions, and ultimately make their own decisions on what are appropriate risk speculations and appropriate position sizing. This editorial is simply to illustrate the overriding concepts on why I’ve isolated these types of companies in my own portfolio, and their potential value drivers from my unique vantage point.
Thanks for reading and stay tuned for articles on precious metals and macro economics later this week.
Ever Upward!
- Shad


