


Precious Metals Update – Boomer Rocks Surge In Value, While Gold And Silver Stocks Climb The Wall Of Worry
Excelsior Prosperity w/ Shad Marquitz – 09-28-2024
After a very eventful week in the precious metals sector, it’s again time to reflect on where things are at on the gold, GDX, silver, and SILJ charts with regard the technical setup. Additionally, we’ll be hearing interviews with a number of PM sector thought leaders.
Let’s kick things off with the daily chart of gold, that has continued plowing higher and higher making a series of all-time highs for the last year or so. It has remained a thing of beauty…
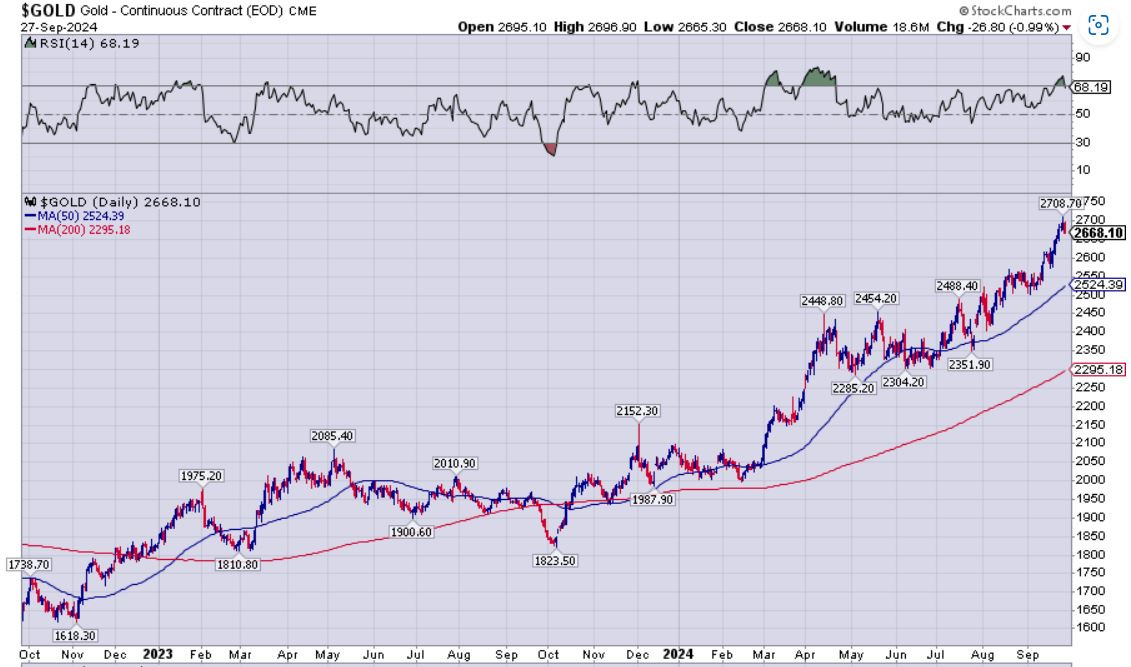
When we look at the epic move gold pricing has made from it’s November 2022 bottom of $1618.30, up to Thursday’s intraday high of $2708.70, (up over $1,090.40 from low to high), it is hard not to be impressed. If people recall, back in November of 2022, there was a chorus of negative nancies, half-baked technicians, and even respected market pundits suggesting that since gold had failed to hold key support in the $1675 range, that it was heading back down to retest $1450 or even $1375 support.
Well, clearly that didn’t happen, and the yellow metal has been climbing the wall of worry ever since then and blowing past numerous targets and expected pullbacks from many technicians, over and over again. It also very much feels like a “stealth bull market” from the standpoint that the mainstream financial media has hardly even acknowledged or spent much time on this absolutely historic run higher in gold to new highs. The general public, except those shoppers that have been loading up on physical gold at Costco over the last year, likely have no concept of the reduction in the purchasing power of their fiat dollar in relation to the time-tested monetary metal that is gold. Actually, that may be a good thing, as it means we are still nowhere near a mania in this sector.
The RSI dipped back down the end of last week out of overbought territory, (where it had an overbought reading over 77 on Thursday), but then closed on Friday back down to 68.19. Of course, a pullback now at these levels is not out of the question, as this has been a really strong move in gold futures prices, and we may need to see some backing and filling to ring out some of the recent froth. The 50-day Exponential Moving Average (blue squiggly line) has offered support a number of times in the past, and it is still sloping up higher. If we do see a corrective move in pricing develop in the weeks to come, then it may come down to test a rising 50-day EMA; meaning price will likely find its footing somewhere between the range of that moving target (currently at $2,524.39) and where gold actually closed on Friday at $2,668.10.
It is going to be instructive to see where gold closes this month of September and in conjunction with that how it closes the 3rd quarter this coming Monday September 30th.
Let’s see how these higher gold prices have translated over into the action in the larger gold producers, best represented in this daily chart of the VanEck Vectors Gold Miners ETF (GDX).
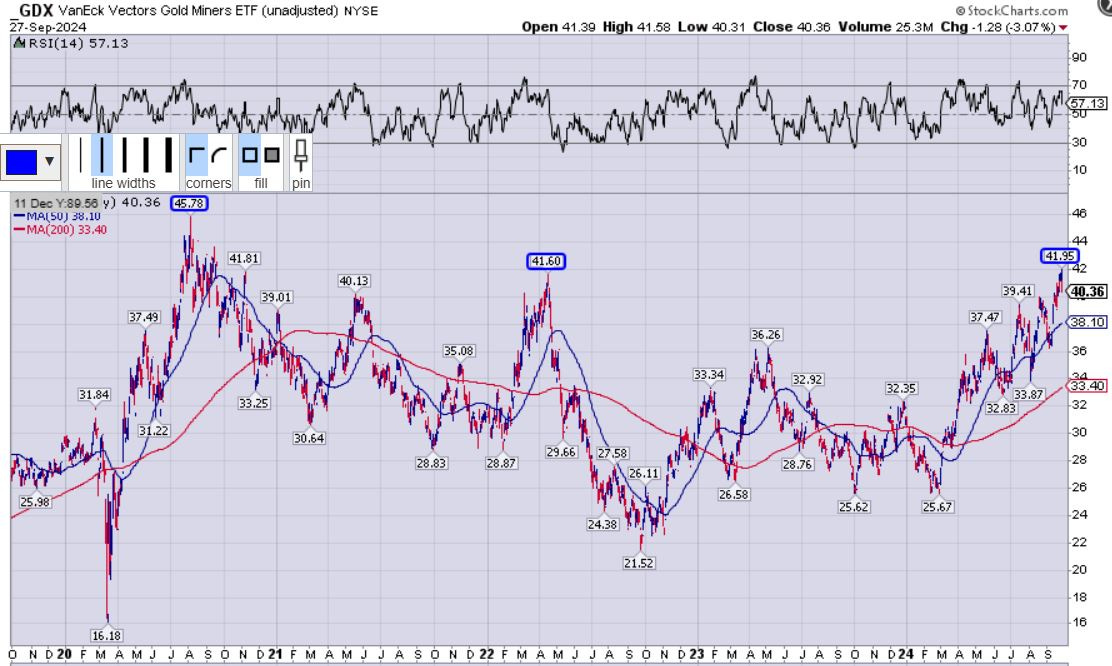
We do see a bullish pattern unfolding this year in GDX, with a series of higher highs and higher lows, and it finally punched up above the 2022 peak of $41.60 on Thursday, but then closed the week back down below there at $40.36. [Hey it only took $2,700 gold to give it a kick in the pants]. It would have been more bullish to see a weekly close above that prior peak $41.60. At present, the RSI is more in neutral territory with a closing reading on the daily chart at 57.13, so it would be nice to see the gold equities keep ripping for a bit longer to play some catch up.
It is still quite stunning that with record average margins of over $1,000 per ounce of gold for the larger producers, and some of the lower-cost producers and royalty companies with record margins of $1,500 - $2,000 per ounce, that the GDX has been unable to get back up above even the 2020 peak at $45.78, much less the $55-$65 peak pricing zone the ETF hit back in 2010-2012.
All this week, over at the KE Report, I’ve been asking some of the best thought leaders in the space what they thought of this conundrum of seeing the best margins ever, and yet, not seeing the gold stocks in GDX rip nearly as high as prior cycles; when the margins were nowhere close to as good, and the gold price was nowhere close to as high. [The hotlinks should take readers and listeners here directly to those parts of the interviews].
Sean Brodrick – Accumulating Junior Mining Stocks As Gold, Silver, and Uranium Prices Move Higher
Dave Erfle - Gold Hits Another All-Time High: Analyzing the Bull Market
Brien Lundin - Gold at $2,700: Key Factors Driving the Market Uptrend And Metals Equities
Earlier this week, Kitco’s Paul Harris interviewed Brett Heath of Metalla Royalty & Streaming, and they also got into this same topic of the record margins that the gold producers are experiencing in Q3 and heading into Q4. Additionally, they also breached a topic we’ve been discussing in the last few articles on gold here in this channel, with regards to what the appropriate base case gold assumption should be on development-stage projects, in lieu of the substantially higher underlying metals prices for most of this year.
Gold miners are on the cusp of historic margins - Metalla Royalty & Streaming's Brett Heath
Again, this topic of a more realistic and appropriate “base case” metals price assumption for the gold development projects and the complete valuation mismatch in the developers has been a hot topic as of late. I took a deeper dive into this subject, over on the KE Report this last week, with The Hedgeless Horseman himself — Erik Wetterling.
Erik Wetterling – Derisked Junior Gold Developers Are Presenting Amazing Valuation Disconnects
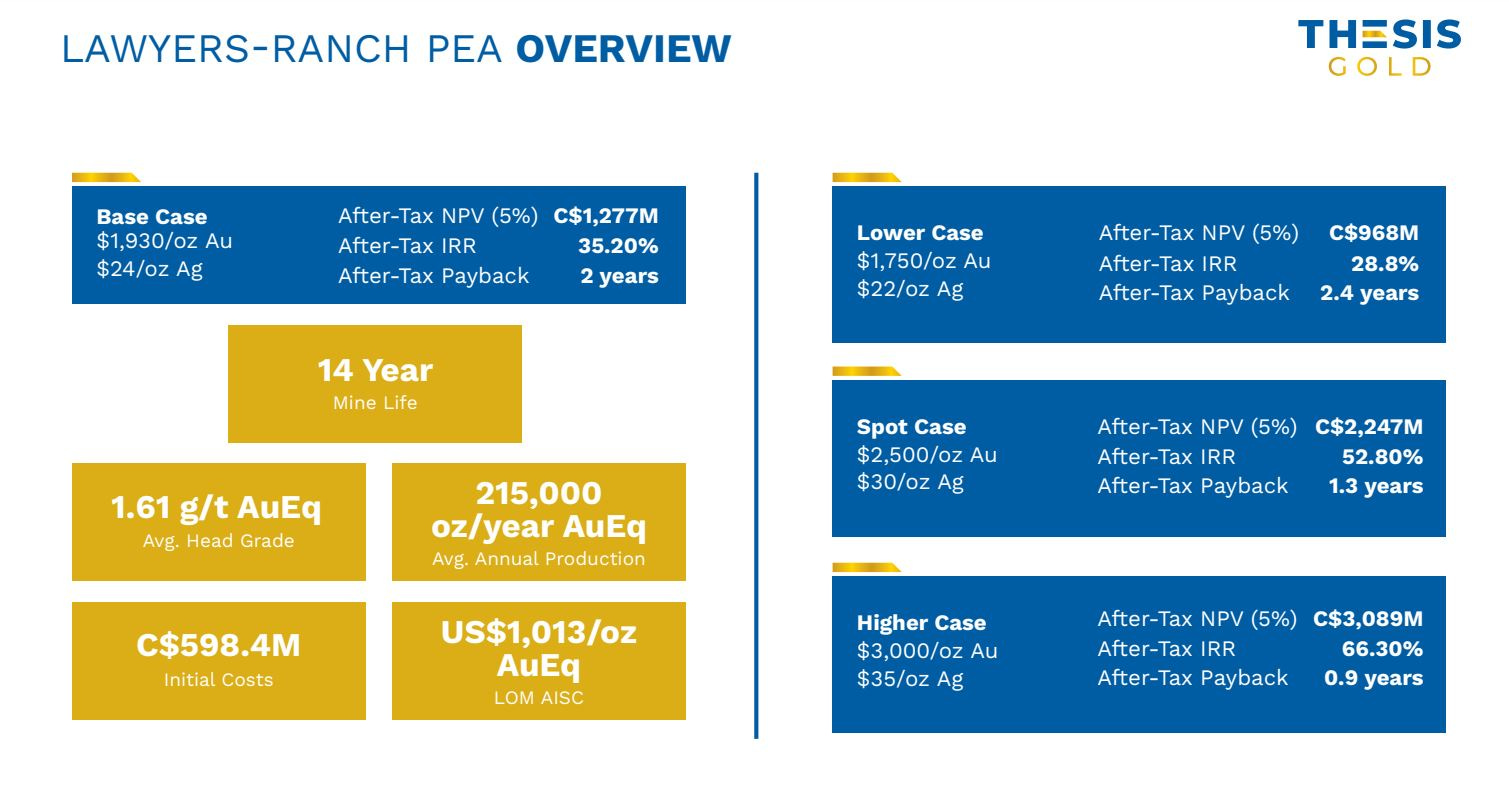
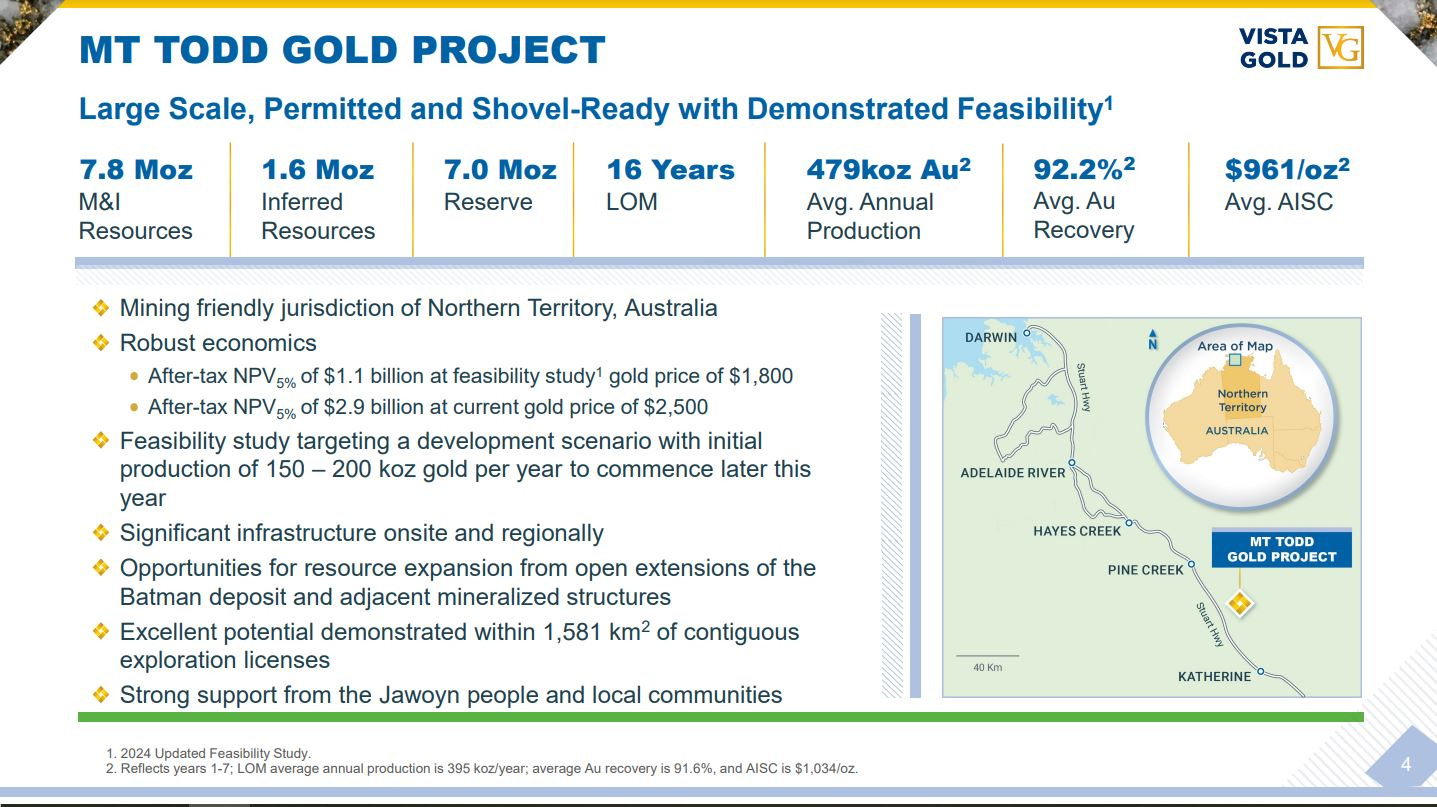
In that interview above I mentioned a few companies (Thesis Gold, Vista Gold, Skeena Gold) that I felt had done a better job with more realistic base case price assumptions, while also dealing in the real by putting in metals sensitivities tables closer to spot prices (using $2,500 gold and $30 silver price assumptions), but then also showing the upside case at $3,000 gold and $36 or $40 silver price assumptions.
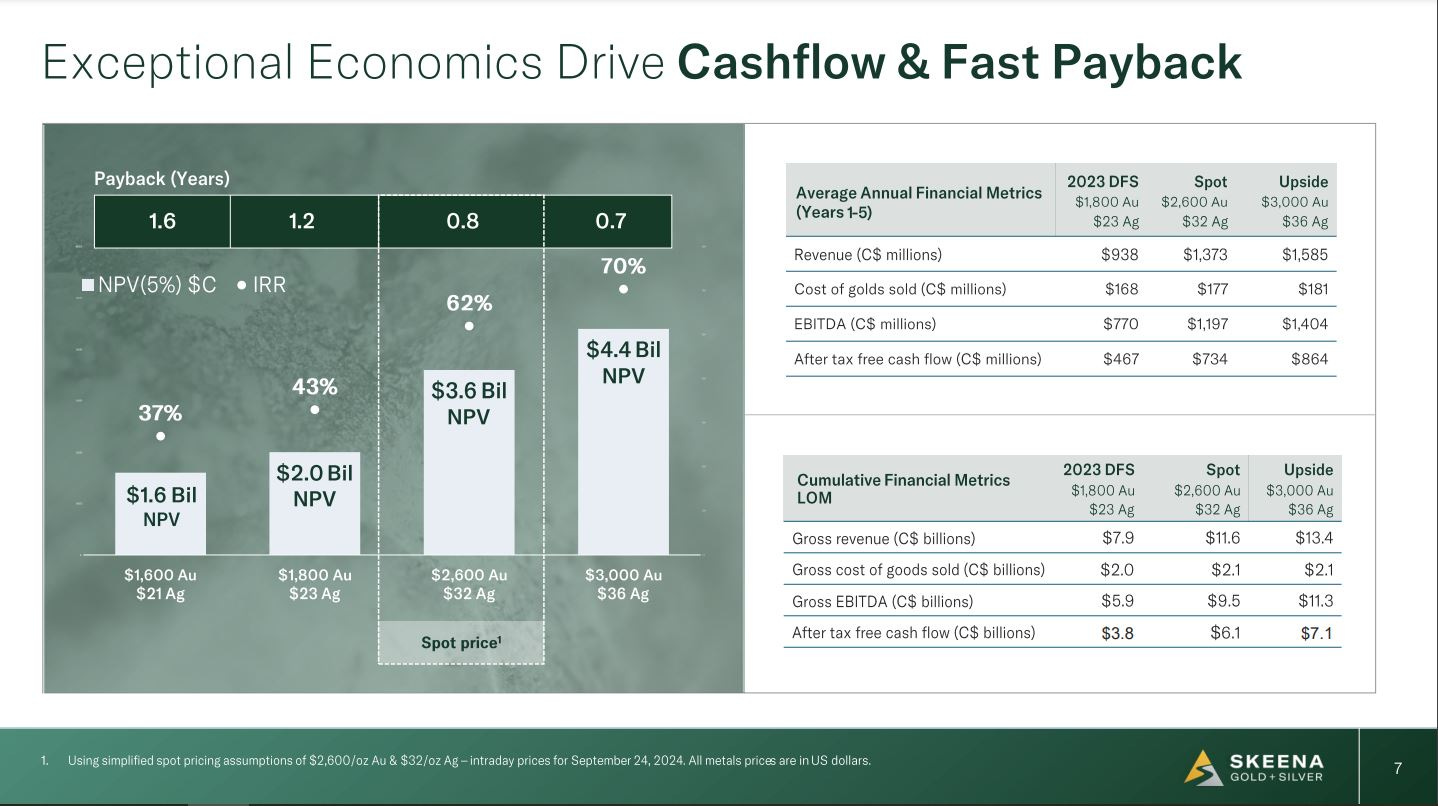
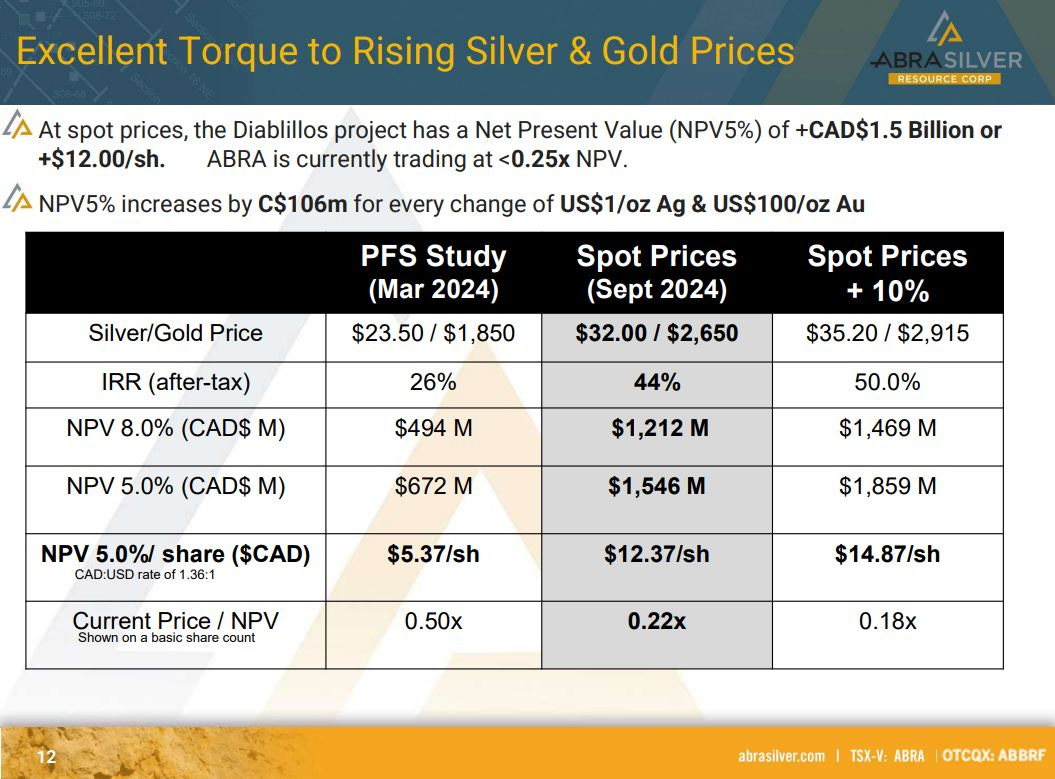
I’d add to that list another good slide in the new AbraSilver Resource corp slide deck where they used spot prices at $2650 gold and $32 silver in their metals sensitivity table, and anyone can see the huge jump in NPV and improvement in all the other metrics from their PFS. This is precisely the point for valuing these developers in the here and now, and most of the market seems content to short-change how significant these higher current metals prices are for these projects.
For years and years we were told, over and over again, by almost every talking head in the PM sector that we really need to use the discounted cash flow method at “current metal prices” to compare and value different projects. So, when gold was $1250, $1375, $1400, $1500, $1600, etc… the response was always the same…. “Even if people are bullish on gold, we need to value projects with where the metals prices are in the here and now.”
Well, now that gold has climbed up to around $2,700, then it is astounding to have companies still using $1,250, or $1,400 or $1,500 or $1,600 metals price assumptions. Yes, WE ALL GET IT, that shows their project is economic a lower prices. We are not going to see gold back at those levels, or even at $1,700 or $1,800 for a long time, so let’s deal in the real and at least use the longer-term gold consensus pricing. It just so happens that was just moved up again from $1,950 to $2,050. Some people reading this may shriek, but come on… We hit $2,400 gold in April, and tested it a few times in May and July, and have been above it since then.
Brian Leni, of Junior Stock Review, is in agreement with this approach, and in his interview with us this last week, he broke down how and why he was using $2,400 gold in his valuation metrics on the developers, but is also open to raising that if the yellow metal can hold onto current levels above $2,500-$2,600 for a couple more months and build some pricing history and support here.
Brian Leni - Analyzing Resource and Development Stage Gold and Copper Stocks
Look, in the stocks market, with regards to all the other industries and the companies within those respective industries, (cars, homes, electronics, restaurant chains, retail sales, semiconductor chips, utilities, etc…), are valued based on where revenues and forward earnings are at today’s prices. Why should gold or silver producers or development projects be judged so much differently? Yes, these are long life assets that go through many cycles, but so are homes and cars and electronics. Yes, metals prices can always pull back lower again… OK, glass is half empty Captain Obvious doubters…, but metals prices could also just as easily blast higher (like they have been doing all year long). That is the whole reason why almost every other sector and industry markets and is valued using the current price of assets.
In a way it’s like a tragic comedy. There are so many investors, and also so many mining executives, that constantly whine about how their stocks are undervalued, but in all honesty, the mining industry is absolutely terrible at marketing the value of mining or the companies producing the metals as a digestible story to generalist investors. Even this year, with so many tailwinds at their backs this precious metals sector in press releases, corporate slide decks, and in economic studies (which are often little more than glorified marketing pieces) have done an atrocious job at remotely playing to their obvious strengths of fat margins and robust economics. Is it really any wonder that generalist investors remain nonplussed about mining stocks…? The industry is still pricing itself for 2017-2019 prices, instead of 2024 prices. It’s time to wake up… That’s not a winning strategy folks.
Alright, with all that said, let’s shift over to Silver and have a look at how pricing is doing on a technical basis.
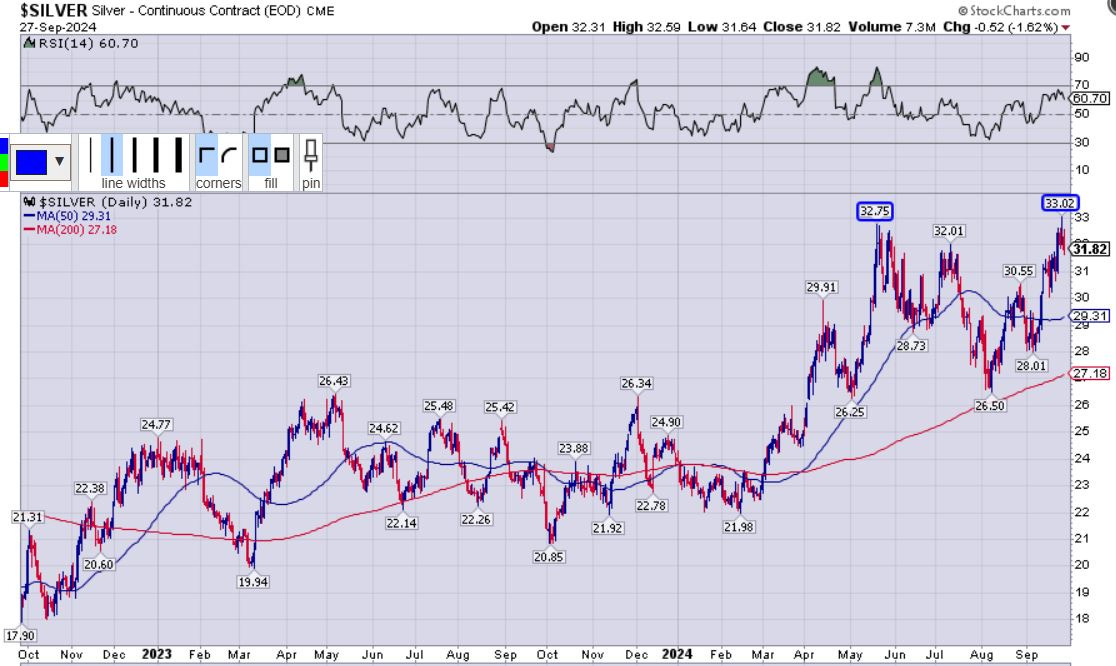
Silver just put in a higher-high intra-week of $33.02, eclipsing the recent peak at $32.75. Now, you can bet your bottom dollar, and bet your silver dollars, that there are going to be a raft of technicians coming out and suggesting this will be a double-top in the lessor precious metal… and maybe it will end up being just that. However, as a quick reminder, that is the exact same thing they said about that $32.01 level, and in this case the peak from this last week is higher not lower, which positions things in a more bullish posture. For those that would say it’s nit-picking to discuss a daily blip to a higher level, the answer is – Yeah, technically silver hit a higher level this week, and this is “technical analysis,” where the attention is on the details of price action, so technically – it matters.
It is also worth noting that silver is still well above both the 200-day EMA and 50-day EMA; so that is also solidly bullish action. The RSI is currently at a reading of 60.70, so while it is showing accumulation, it’s still not overbought technically. Bulls will want to see silver stay above the 50-day EMA, and more importantly stay above the 200-day EMA, on any corrective moves that come in the weeks and months ahead. Really, if Silver can get a bit more momentum going, it could easily punch up to $34-$35 overhead resistance in short order, which would spike the punchbowl in the silver equities that are in production or have optionality to millions of ounces defined in the ground.
Let’s have a look at the silver equities price action via the Amplify Junior Silver Miners ETF (SILJ).
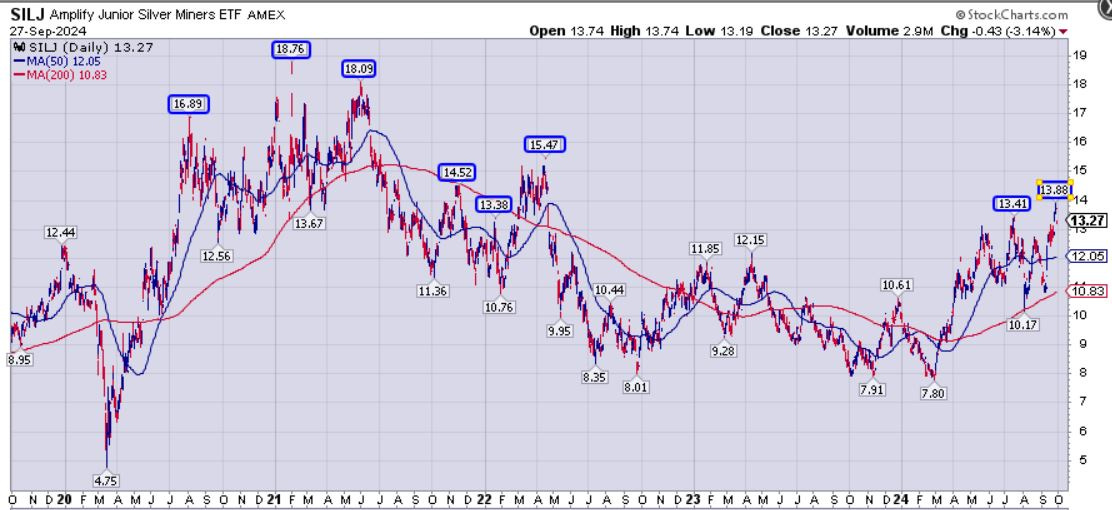
(SILJ) put in a higher recent peak this last week at $13.88, but then closed down lower to end the week on Friday at $13.27. Still taking out both that recent peak at $13.41, and the lateral price resistance from the peak from back in January of 20233 at $13.38 is significant progress that silver equities are making as a group. Silver stock bulls will want to see the next lateral price support of $14.52 from November of 2021 cleared on a closing basis, and then the May 2022 high of $15.47 comes in as next overhead resistance.
Currently, pricing is still well above both the 200-day EMA and the 50-day EMA so that is clear bullish action (even if it isn’t as bullish for the silver mining stocks as many would have expected). Similar to gold equities, the silver equities are trading at lower levels than they were when silver was at lower levels in late 2020 and early 2021, but that is just the kind of sentiment and momentum headspace that we are in present markets.
We had a lot of interesting chats with guests on the KE Report this week regarding silver and the silver equities, but the clear standout longer-format discussion on the silver equities was with Peter Krauth, author of the book The Great Silver Bull and editor of the Silver Stock Investor newsletter. This is a wide-ranging conversation where we cover many areas of consideration like Fed rate cuts, gold breaking to new all-time highs, and silver popping back above $32, the gold:silver ratio, margin expansion in the producers, which stocks have the most torque, merger and acquisitions, project divestments by larger producers down to the juniors, and much more…
Peter Krauth – Pro Tips On Investing In Junior Silver Stocks – Wheaton PMs, Pan American, Gatos, First Majestic, Apollo, Sierra Madre, Aya, AbraSilver, and Summa
That’s it for this week’s technical update on the precious metals sector, and some of the key interviews on the PM equities from the KE Report.
Thanks for reading and may you have prosperity in your trading and in life!
- Shad