
Let's Put Some Technical Perspective Around This Recent Bearish Gold and Gold Stocks Trend
Excelsior Prosperity w/ Shad Marquitz (06-10-2026)
As precious metals investors continue to wake up each day to red on the screen, crashing stock charts, and shrinking portfolio balances, that can really start an emotional panic cycle. I’ve been receiving a lot of incoming messages from resource investors that seem right on the cusp of throwing in the towel, or that are legitimately worried that the PM and commodities bull market is over.
Sure, it is a possibility that the decade-long gold bull market, that started in December 2015 at the $1,045 Major Low, did finally top out in January/February of 2026 at $5,626. Any unbiased and rational market observer needs to be open to that as a potential outcome of what we’ve seen play out since the Q1 peak earlier this year.
However, that sure doesn’t seem like a high probability; based on the macro backdrop, where the underlying fundamentals that have been driving this PM bull market haven’t really changed that much.
We also did not see the valuations in the gold stocks get to extreme levels on Price to Net Asset Value (P/NAV), even after many stocks ran up 5X, 7X, 10x+.
Most of the PM producers and developers never fully-factored in these higher metals prices, considering where metals prices are still at today, much less those Q1 all-time high levels in gold or silver.
The PM ETFs did not massively outperform the metals, and didn’t have the kind of torque and leverage, as a group, that we’ve seen near other sector tops.
Having said all that…
We have been in an undeniable short-term cyclical bearish trend in the precious metals sector ever since the March breakdown in support, and it accelerated recently.
This move down is getting pretty long in the tooth at this point, and we are likely putting in the final throws of a capitulation move that will do what it always does — wash out the remaining weak hands… at least here in the near-term.
Of course, this is no fun at all for those of us with serious exposure to gold, silver, and the PM equities, but patient investors, or those that have the guts to begin accumulating here in the near-term, are going to be well-served.
So, let’s get into it…
Let’s look at the Gold daily chart for technical insights:
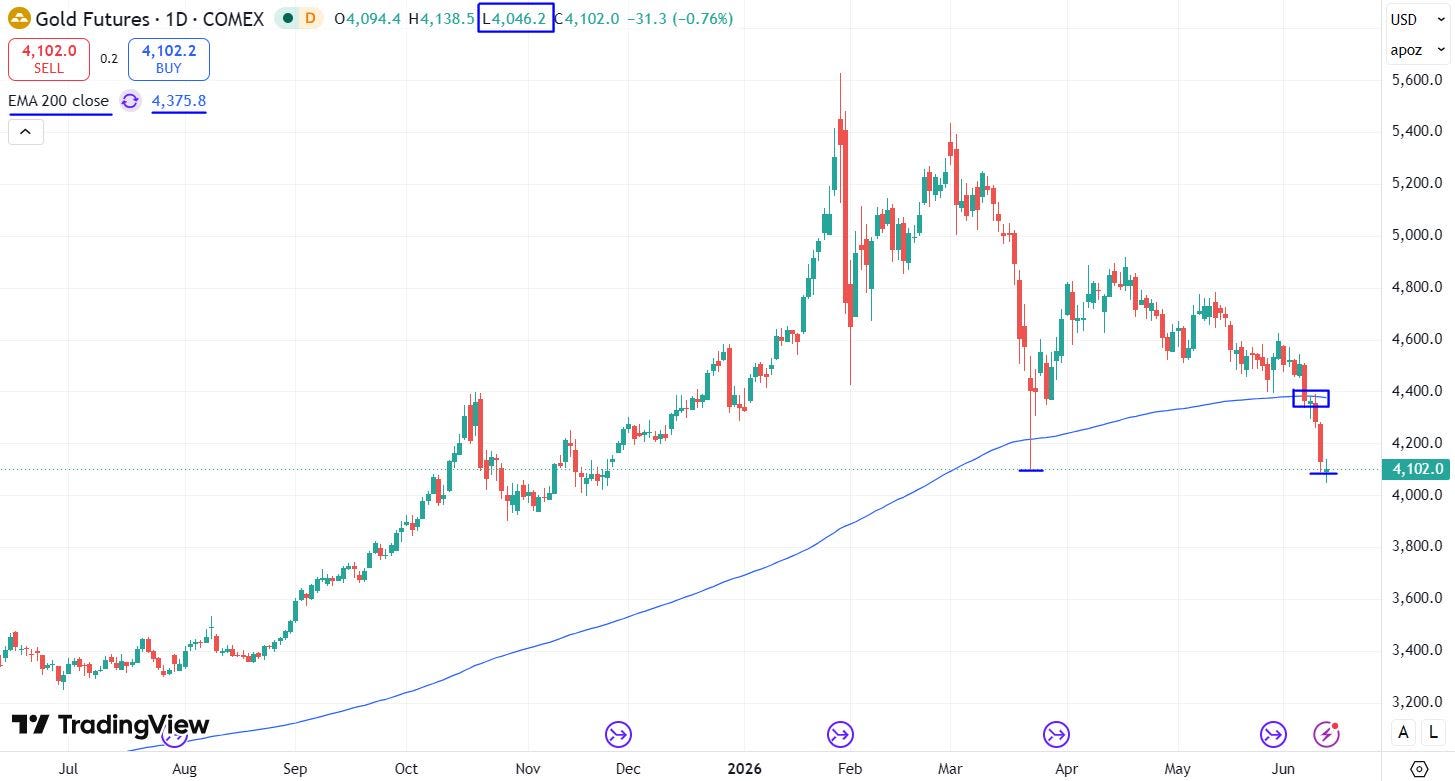
The first leg of the bearish pattern was the move down to $4,100 on March 23rd (noted by a little blue hash mark I drew on the chart).
Seeing gold briefly break the 200-day moving average in March was a shot across the bow, but then gold bounced back up above it right away in April and May. Some figured “OK then… crisis averted...”
However, watching gold trending lower in later May into early June was getting concerning again, and most technicians were glued to their screens watching the 200-day moving average again; (to see if it would hold as support).
Obviously, during last Friday’s bloodbath, that 200-day moving average support level finally broke, and then out came the knives from the PM bears. This created the downside selling momentum that we’ve seen so far this week. That’s to be expected when support levels break.
Yes, this got ugly fast, and yes this created some chart damage that now needs to be repaired... but just like nothing goes up in a straight line, nothing goes down in a straight line either. Trends always revert to the mean… eventually.
Gold tagged a new lower low earlier on Wednesday the 10th at $4,090, which was a mirror of the March 23rd low around $4,100; albeit slightly below it.
I’ve been watching the tug-of-war, on either side of this $4100 price level, going on with bulls and bears for the last few hours. This is to be expected around a lateral price support from a former prior intermediate peak or trough.
Now, this could all change on the next dramatic news headline overnight or in the morning, but at least at present, this is starting to look like a point of indecision on the gold futures chart, where pricing may be putting in a potential Double Bottom. (as noted by the other hash mark on the chart).
Gold bulls will want to see that ~$4,100 level hold (it doesn’t have to be perfect, and again, already dipped below it briefly)… but if the yellow metal just quits going down and actually consolidates here, then it would be an ideal spot to start building a base of lateral price support from.
Yes, technically gold futures put in even a lower low than that in overseas trading at $4046, to begin tomorrow’s daily candle, but that dip was quickly reversed and then shot up to $4,138.
Gold is now back trading right around that magnetic $4,100 level, at the time of writing this article. So far, that is making it a thin green doji candle… which is mostly indecisive… but with a mild bullish tilt to it.
To me, this is starting to look like selling exhaustion; where bears are running out of energy to keep pushing pricing lower. So, it is possible the worst of the corrective pattern is behind us now. We’ll need more data and follow through to know, but just calling it like I see it based on where we are at present.
Of course, gold bulls still have a lot of work to do now to regain that 200-day exponential moving average {currently at $4375.80}. Clearly things are getting too oversold here, and again, nothing in the macro fundamentals has changed really.
The Gold stocks have been even uglier on this correction... so, let’s look at (GDXJ) as a good proxy for the mid-tier gold equities:
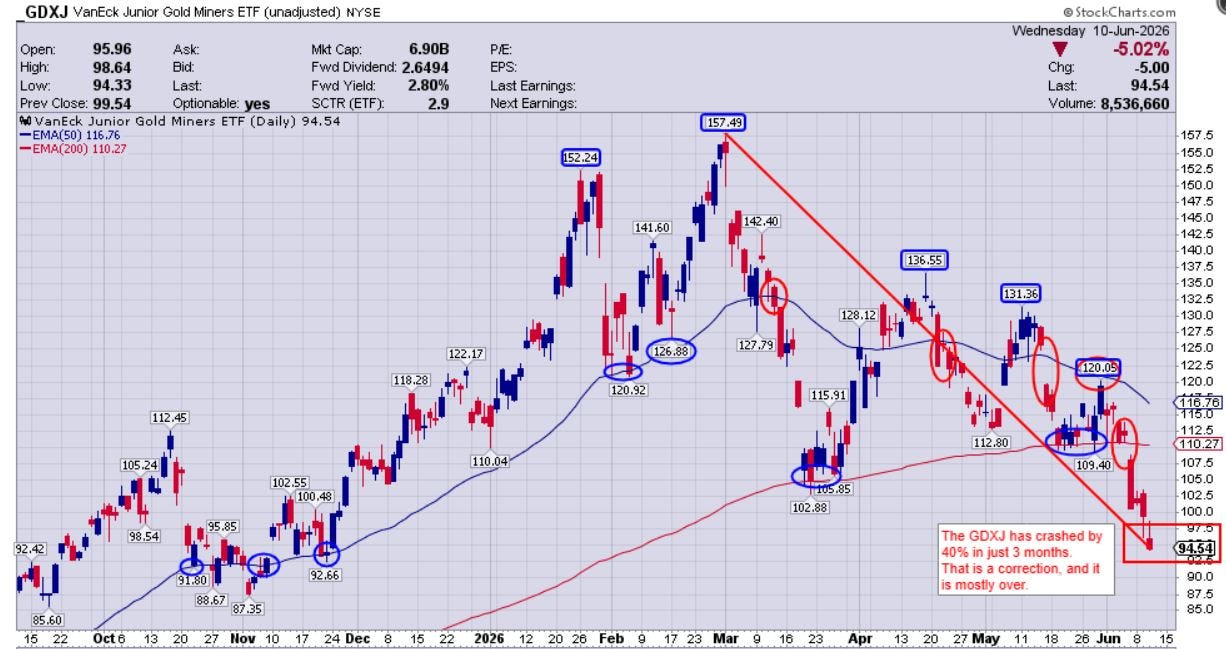
The (GDXJ) peaked out in late February at $157.49, and has put in a series of “lower highs” since then at $136.55, $131.36, and then $120.05... This is a bearish chart pattern, and it clearly has accelerated to the downside.
(GDXJ) pricing had been respecting the 50-day moving average as support during last year and the early part of this year, but then that level gave way during the March carnage.
(GDXJ) pricing went down and consolidated along the 200-day moving average and bounced from there in late March (which is not a surprise, and that is precisely where we’d expect to see support come in)
(GDXJ) got back above the 50-day moving average briefly in early-April, but couldn’t hold it, and lost that level again in late-April. That same pattern played out again in May; getting above the 50-day, but then losing it again.
The issue in May was that “Spring Fling” rally in (GDXJ) made a lower high, and didn’t just break the 50-day support, it gapped down in an ugly fashion = bearish action.
Again, (GDXJ) found support along the 200-day moving average for the latter part of May, (exactly where we’d expect to see support come in), and PM bulls were hoping that would hold…
Unfortunately, as we know, (GDXJ) lost that 200-day MA support last Friday, gapping down through it, and it has been super ugly ever since then... as bears pressed their bets.
Todays close in (GDXJ) at $94.54 is essentially a 40% crash from the February peak back at $157.49. That qualifies as a washout bear market move in anyone’s book, but even that is also getting long in the tooth at this point.
Could these gold stock ETFS keep crashing where they go down 50% or 60%? (Sure they could...)
Many of the high-torque producers are already down that much… but no trend just keeps going without taking a break and providing a counter-trend move.
To be crystal clear, I really do not like that 50-day EMA sloping down towards the 200-day EMA as that could be setting up for a future “Death Cross;” however, this extreme selling pressure is really starting to get overdone here.
The RSI just tagged 30 in (GDXJ), which is the very edge of an oversold reading. Could it get more oversold…? (Of course it could).
The CCI is (-210), the lowest reading we’ve seen since the March low.
At one point the shorts will start covering to book their gains, which will bring in new buying.
I nibbled on a few PM stocks yesterday and today, to put my money where my mouth is… but am cognizant I could get cut up on those trades.
We can make many of the same exact points for Silver and SILJ, but I think the most revealing chart will be this last one for today:
*Hat tip to my buddy, Dave Erfle, for putting this 0% bullish reading in the (BPGDM) back on my radar yesterday on the KER.
The BPGDM (Bullish Percent Gold Miners) is calculated by determining the percentage of mining stocks within a specific index (typically the HUI) that are currently displaying old-school Point & Figure buy signals.
This indicator operates on a scale from 0 to 100 percent, reflecting sector-wide gold producers breadth and sentiment, rather than individual stock analysis.
It is not a perfect timing tool, but when considering it in concert with the extreme selling pressure and breakdown in gold and gold stocks we’ve been seeing, then it gives us another layer of data for consideration.
We’ve talked about this indicator a number of times at market extremes; most recently writing about it when it was flashing the super-frothy 100% bullish reading back in January of this year. That was just as rare and extreme, from an overly bullish reading, as this overly bearish reading is today.
5-Year ($BPGDM) Gold Miners Bullish Percentage Index chart:
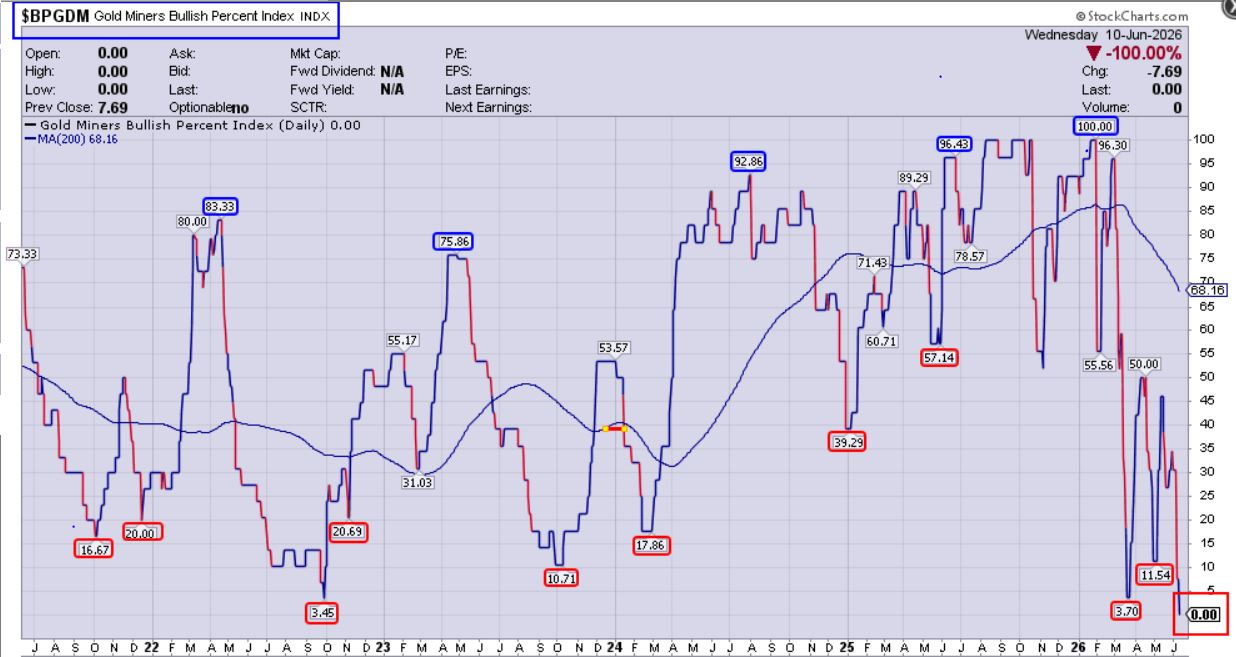
With the ($BPGDM) one can see that — typically a high reading is in the 70%’s 80%’s, or 90%’s.
Late January of 2026 was a true tell of the frothiness in the sector when 100% of gold stocks were in a bullish posture. That rarely happens, and things were clearly over-cooked coming out of the VRIC conference this year. We wrote about this signal at that time, and as it was happening.
Conversely, a bottoming low reading in the ($BPGDM) is typically in the teen%; or occasionally, in extreme moves, even down in single digit percentages.
Note that “false breakdown” back in September 2022 in the PMs saw a reading of 3.45%.
The really ugly March we just had in 2026 saw a similar low reading of 3.70%
Currently the ($BPGDM) reading is at 0% bullish gold stocks. That is an EXTREME reading to the downside… and can’t persist. There will be a relief rally…
When one considers how washed out the gold producers are, just several weeks after reporting their all-time record Q1 earnings season, chock full of record metrics for EBITA, Revenues, and Cashflows; then this is a bizarre juxtaposition.
Bottom line... I don’t expect this this bearishness to last in the PM stocks. These are the moments where impatient investors exit at the exactly the wrong time, and savvy investors begin accumulating while there is “blood in the streets.”
In a way, I’m glad that the webinar with my friend and colleague John Feneck, has timed out the way it has for next Monday the 15th, because we are getting near an inflection point in these resource stocks and the presentation is aptly titled.
STRATEGIES FOR BUYING GOLD, SILVER AND CRITICAL MINERALS STOCKS… AFTER THE CORRECTION
“A review of select prominent gold, silver and critical minerals equities, including John and Shad’s current top 10 holdings in each of these areas, thoughts on portfolio construction, and Q&A session where participants have the opportunity to ask John and Shad anything related to gold, silver and critical minerals related equities.”
JUNE 15, 2026 3:30PM-5:00PM (Pacific) / 6:30PM-8:00PM (Eastern)
https://www.feneckconsulting.com/event-june-2026
In addition to trading the gold, silver, copper names, we’ll also be reviewing portfolio positions in tungsten, antimony, rare earths, uranium, and other critical minerals names.
John describes our planned webinar more closely in this recent interview he gave:

Thanks for reading and may you have prosperity in your trading and in life!
Shad