


Gold to $3,350 - GDXJ Breaks Out - Charts Of Leading Gold Producers
Excelsior Prosperity w/ Shad Marquitz 04-16-2025
There are a number of specific resource stock writeups in the cue here for gold, silver, copper, uranium, and nat gas; that will be released in the fullness of time on this channel. I’ve been totally swamped this week with taxes, communication overload, conducting interviews, and just trying to keep up with these wild markets in my own trading and reflections… but those future articles are coming soon.
Things are developing so fast in so many market sectors that it is like drinking out of firehose trying to keep up with it all day in and day out. Sometimes it helps just to stop briefly, take inventory of a certain sector technically and fundamentally, and reflect on how it ties in to our investing thesis.
Gold has been one of those sectors over the course of 2024 and 2025 that has made so much progress to the upside, and had so many daily, weekly, monthly, and quarterly closes at all-time highs that it is easy to take it for granted.
Whenever possible on this channel, we’ll do our best to note when those key milestones are hit along the way in given sectors or equities, and review their significance.
So, let’s get into it…
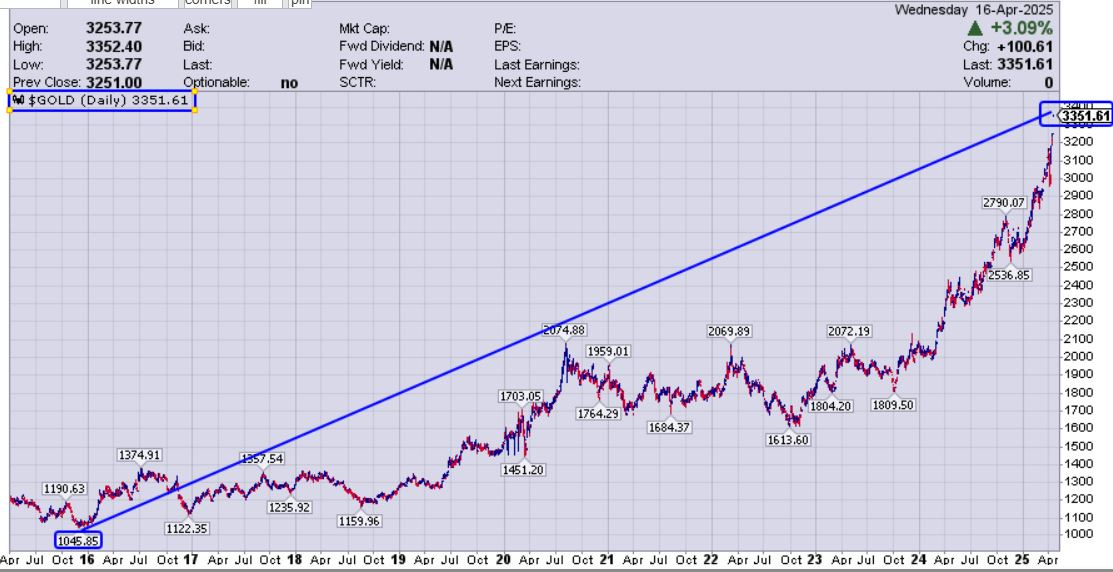
Gold put in its Major Bottom for the current bull market cycle about a decade ago at $1045.40 in December 2015, and it has more than tripled in price since then, closing on Wednesday April 16th at $3,351.60. (yes, another new all-time high close)
Despite that undisputable fact, I’ve continued to notice more chatter on forums and financial publications touting that “the gold bull market just got underway…” and that “we’ve finally ended a decade bear market in the precious metals complex…” (Oh really?)
Sometimes it is helpful to just inspect the data with our eyes and confirm we aren’t the crazy ones.
I invite any reader here to look at the trajectory of the gold price for the last decade and ascertain for themselves whether this chart below is showing a bear market, which would need to keep making lower pricing lows, or a bull market that keeps making higher pricing highs.
What does this pricing trend show your eyes. Bear market or Bull market?
Does it look like it got started a decade ago, or did it just get started?
(This is not rocket science…)
Now I realize there are some subtleties in various approaches, where some analysts want to see gold in a bull market versus other asset classes, like US equities, or oil, or bonds, etc… Those are all interesting correlations to take into account, but not germane to if an asset is in a bull market.
As far as the basic task of assessing whether something is in a bull market or not, it absolutely does not require one asset class to be pitted against another asset class (unless that asset class is the fiat currency that ALL markets are measured against… the underlying currency it trades in… ie the US dollar, or Euro, or Yen).
People buy and sell equities or futures contracts on their trading platforms in fiat currencies. (Now, if you want to price them in cryptocurrencies instead, then knock yourselves out, but most trading platforms where investors buy and sell equities are based on fiat currencies - and the US dollar is still king).
Here are a few examples to illustrate this simple point:
· When cocoa went up to new all-time highs from 2022 into 2024, there were not soft commodities experts measuring cocoa futures versus wheat or corn futures, nor we they measuring it against the S&P 500 or DOW to figure out if it was in an actual bull market.
· When lithium prices and lithium stocks scorched up 8-fold a few years back, we didn’t have people measuring the lithium versus the Russell 2000 index, or lithium versus the 10-year US treasury yield to know if it was in a bull market.
· When oil broke up to recent highs in 2022, after a 2-year ramp up higher in prices coming out of those negative futures prices back during the pandemic crash of 2020, we didn’t have to measure oil versus the Nasdaq or oil versus the 20-year long bond to figure out if it was in a bull market.
· When uranium prices went from $20-$30 in 2021 up to over $100 by early 2024, we didn’t need to measure uranium versus the DOW or U308 spot prices versus natural gas futures to determine if it was really in a bull market.
For this exact same reason, we simply do not need to see gold break out when priced in other asset classes (ie… stocks, bonds, or a given commodity index), to determine if it is in a bull market or not. Sure, it is nice to see those breakouts in ratio charts or comparison charts, or breakouts above downward sloping trendlines, etc… but they are totally not required to figure out if the pricing chart is bullish or not.
All we need to do is pull up a pricing chart, and see if the trend is from lower prices to higher prices in an up-and-to-the-right bull market, or if prices are trending from higher prices to lower prices in a down-and-to-the-right bear market. (Yes, it IS that simple.)
This is the most basic technical analysis anyone can do to quickly size up an equity or sector, and it seems silly to have to outline this... but here we are.
The issue arises in this information age where we see a lot of otherwise intelligent people making crazy proclamations and doing overly complex technical breakdowns on X/Twitter or charting platforms to try and come up with something “new”… or provide some “fresh take” on an obvious trend.
These people keep twisting their minds into pretzels to try and come up with some unique analysis on gold to differentiate their “analysis” from the rest of the “uninformed,” but they are failing to make the most basic technical observations.
The same thing could be said with quantitative models that are trying to determine if an asset is in a bull market based on sector breadth, volume, or sentiment information. Those are helpful indicators for spotting potential tops and bottoms, but not nearly the same thing as whether or not something is in a bull or bear market.
Here’s reality: Gold has been in a bull market for about a decade now, and $3,350 gold prices were at all-time highs on Wednesday April 16 (once again).
Speaking of sentiment, it is getting better, and there is more “gold buzz” showing up in the media now, but nothing like one would have expected at these historically high uncharted price levels. It is still oddly quiet overall in the financial universe as it relates to gold’s ascent to a series of even more all-time highs thus far in 2025… just like we saw in late 2023 and all of 2024.
To that end, I posted a tongue-in-cheek question on both the KE Report and Ceo.ca blogs late last night / early this morning:
@Excelsior – “$Gold futures are now above $3,300. (currently at $3,311).”
“Please remind me of what price level it is where we’re all supposed to get excited.”
Initially, most PM investors assumed it was settled back when gold took out the $1923 prior all-time high from 2011, during the 2020 run up to $2089.
Then the narrative shifted that we actually needed to see gold break above that $2089 post-pandemic spike peak from 2020, so gold could prove it could sustain and hold above that level.
Then many pundits told us… for sure it was going to be a move above $2,100 that would bring in all the generalists, and then the party would begin… but then the narrative shifted that $2,100 wasn’t enough of a break above the prior $2089 peak, so that target then morphed to be a move above $2,200. Yeah… that should do it….
Then it became a game of pundits throwing out round numbers, $2,400, $2,500, $2,600, etc… When sentiment for the PM sector wasn’t that much better, and gold stocks still weren’t getting valued like most thought they should, we often joked over at the KE Report in interviews - “What is it going to take – $3,000 gold?”
Then we recently got to $3,000+ gold. While there is some more enthusiasm in this space, it is nothing like what resource investors would have expected a half dozen years back for when we finally got to this moment and price level.
Lately gold futures have crept up through $3,100, $3,200 and now over $3,300 and most resource forums and media outlets are still not really THAT excited, and we are still miles away from any type of mania. No rocket ship emojis that we are “heading to the moon!” and sadly, no pictures of Lambos for gold investors.
On one level that is encouraging, because this massive ascent higher in the yellow metal hasn’t been anything like a typical blow-off top. However, on another level, it’s starting to get concerning. We’ve been seeing a perfect storm for gold for years now, and yet the gold stocks are nowhere near where people imagined they’d be.
So, What is it going to take - $4,000 gold? 😉
–> One positive milestone did happen today though:
(GDXJ) finally took out it’s 2020 peak at $65.95 in Wednesday’s intra-day trading, getting up to $66.18, but it still closed at $65.14 (below that prior peak).
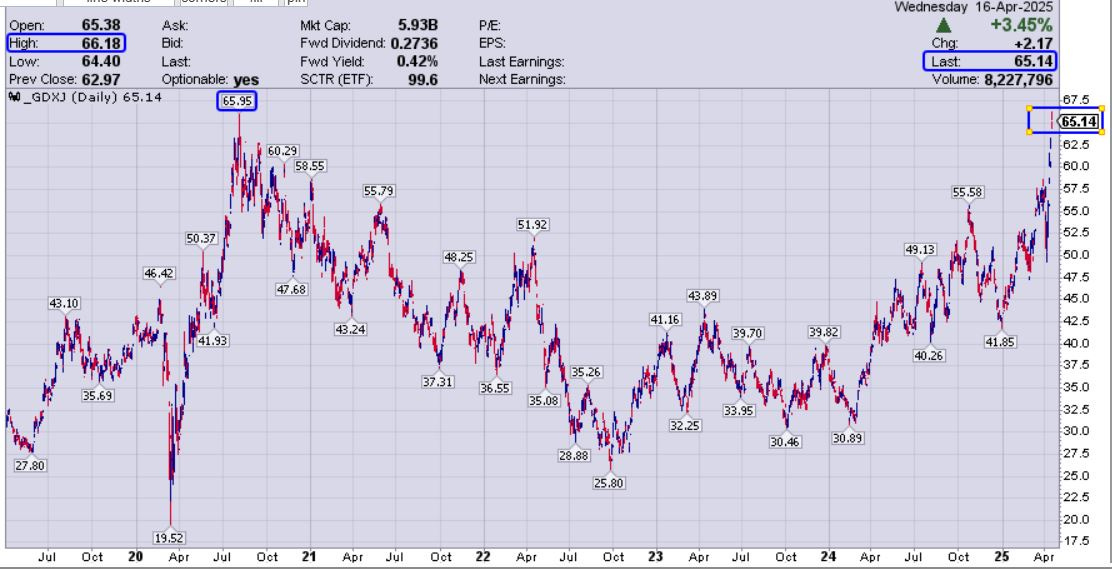
It is simply astonishing that even though the gold price has tacked on nearly $1,300 and producer margins are the biggest they’ve ever been in history, that it took all of that just for the GDXJ (mostly full of mid-tier gold producers… not real juniors) to finally get back to the same level that it hit back in 2020.
>> The GDXJ would have to nearly triple to get back up to it’s all-time high at $179.44 when gold was considerably lower and so were the gold producer margins.
Again… we’re at $3,300 gold…. “Is there anybody out there?”
Having said that, there are some select gold producers that have been trucking right along to new highs for a number of years now; as the early torchbearers.
Let’s end on a high note (literally) with some of these gold producers that have been leveraging the underlying metals prices.
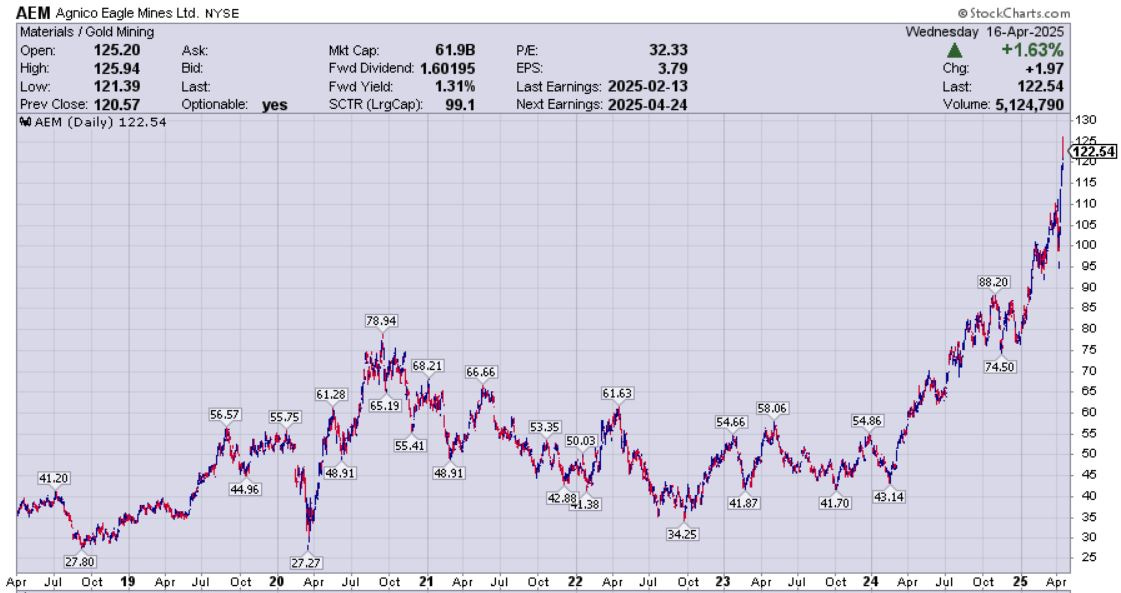
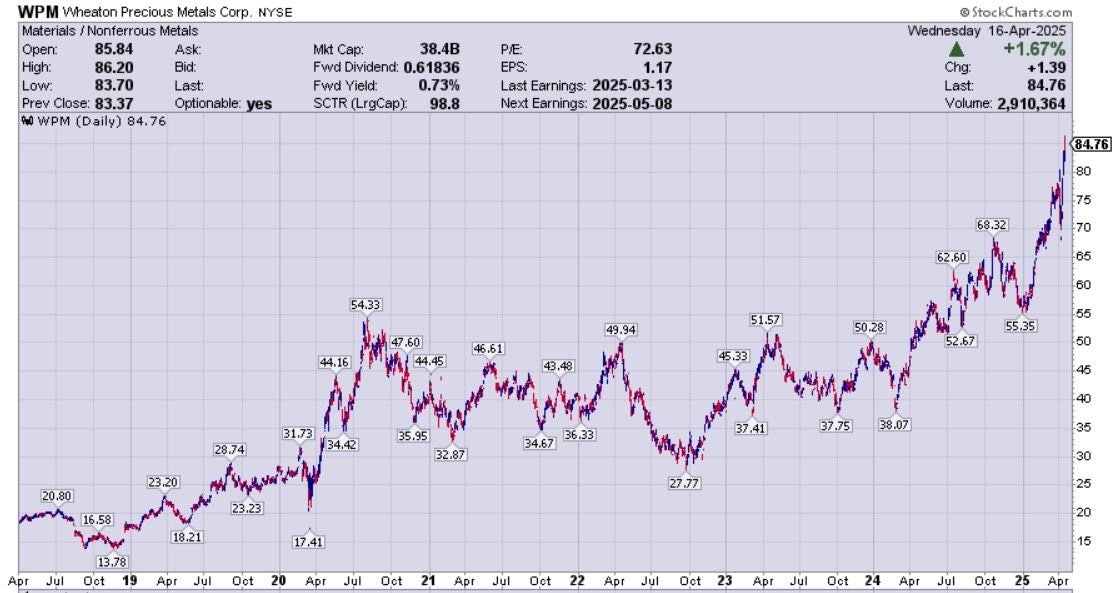
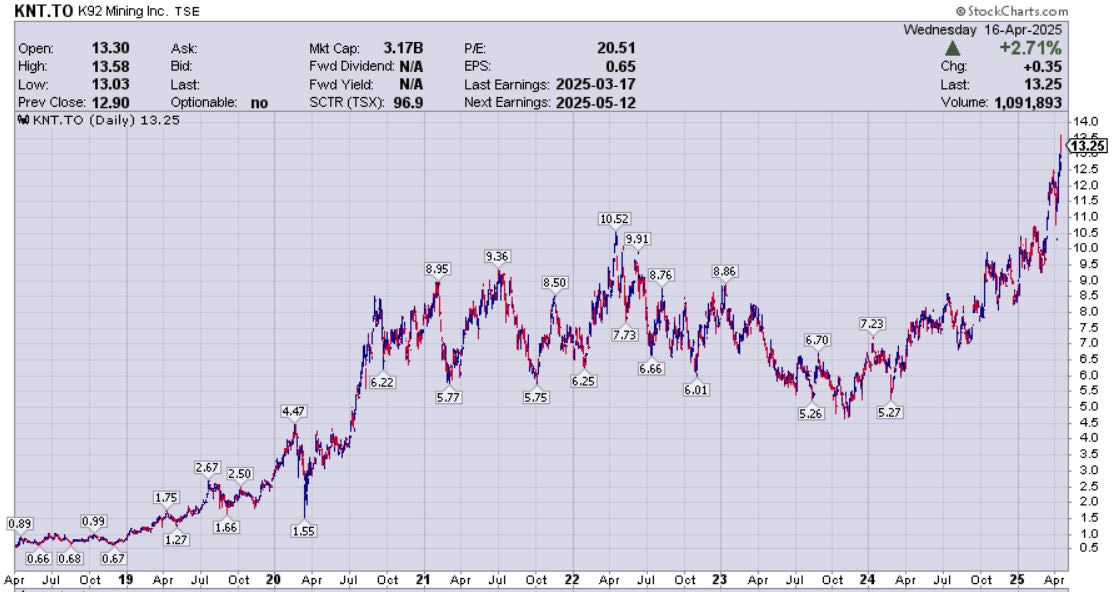
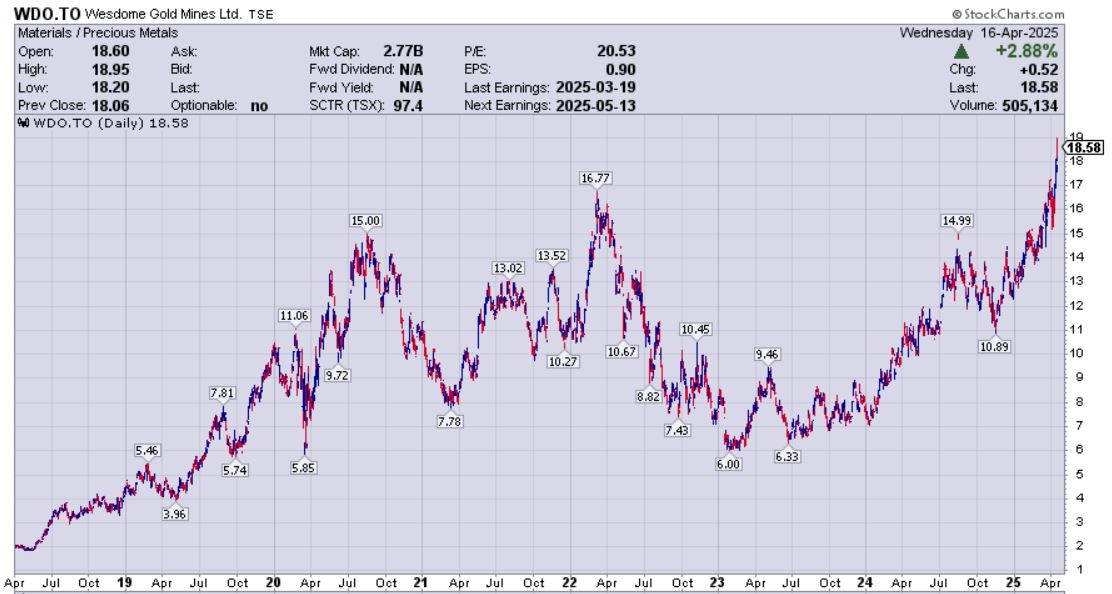
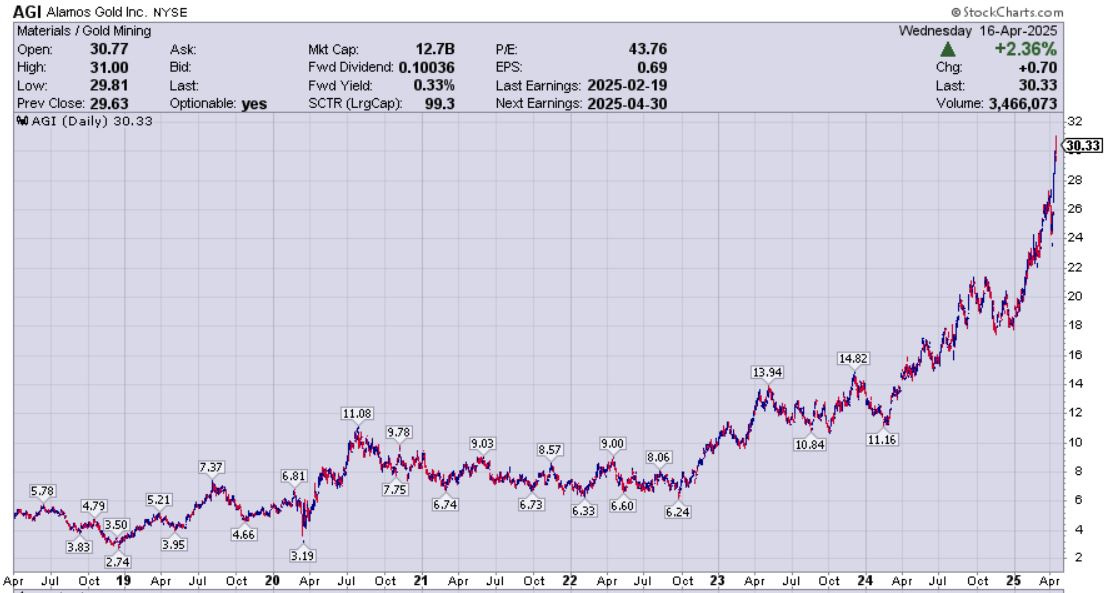
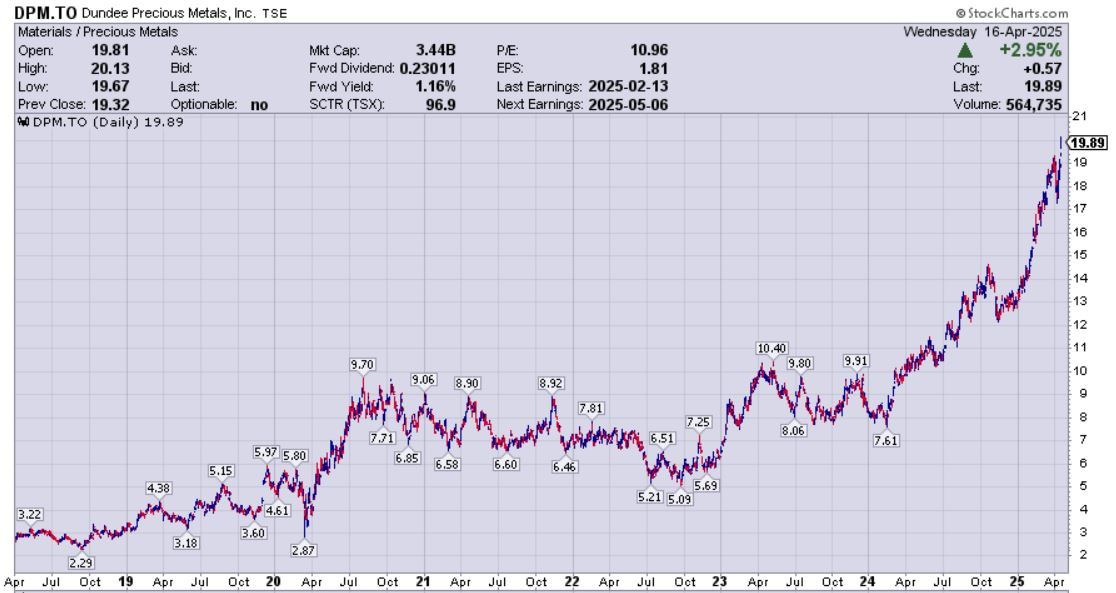
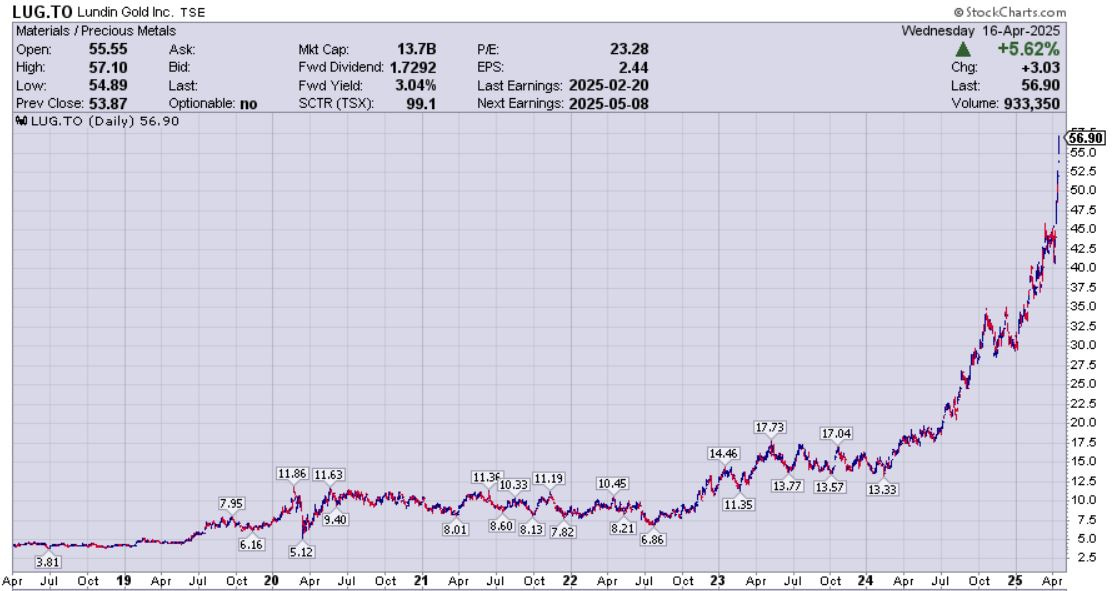
So, there we have some factual data that the best-in-class have actually made the kinds of out-sized moves we would have anticipated more companies in the PM sector to have made in the current gold price, as it keeps running to new highs.
It is also worth noting that they all bottomed on an intermediate level in late 2018, and have spent the last 6.5 years climbing to new highs.
Once again, that is undeniable proof that the gold sector bull market did not “just get started.” No, instead the gold bull market has been raging on for years now, for those that have the eyes to see it.
I’d wager that these sector leaders are all going to have fantastic Q1 earnings numbers, just based on how much higher the gold price averaged last quarter.
The bid showed up in quality larger gold producers first; and rightly so. As more investors wake up to the earnings potential in the gold and silver producers, then the mid-tier to smaller producers will get the next influx of capital.
The quality development projects, with improving economics will also get the incoming bid from investors, once they start to discover the massive valuation disconnects we are seeing at present.
Eye-popping drill results in the explorers will continued to get rewarded in any type of market, but also get additional tailwinds in a bull market environment.
Thanks for reading and may you have prosperity in your trading and in life!
· Shad