


Gold, Silver, Copper, Oil, Nat Gas, And World Outlook Conference Recap
Excelsior Prosperity w/ Shad Marquitz (02-15-2025)

You can see the title for topics that will be covered in this article; so we don’t need a big preamble on global trade, tariffs, inflation, Fed policy, interest rates, the dollar, and all the macroeconomic and media mumbo jumbo…
To be clear, we enjoy consuming information on all those topics. We like to endlessly discuss and debate news and narratives with fellow investors. Those talking points can be both entertaining and relevant for both the larger trends playing out, or even the short-term gyrations within specific sectors or stocks.
The reality is that reviewing the pricing data encapsulates all those macro data points, all rationale, all news, all sentiment, all human behavior, and all institutional and retail trading (both human and machine). That is why price action will always be primary, and it supersedes all financial media and investor narratives. Price is the record of all influences and everything that happened. Period.
So, let’s get into it…
We’ll kick things off as we usually do with a daily chart of gold:
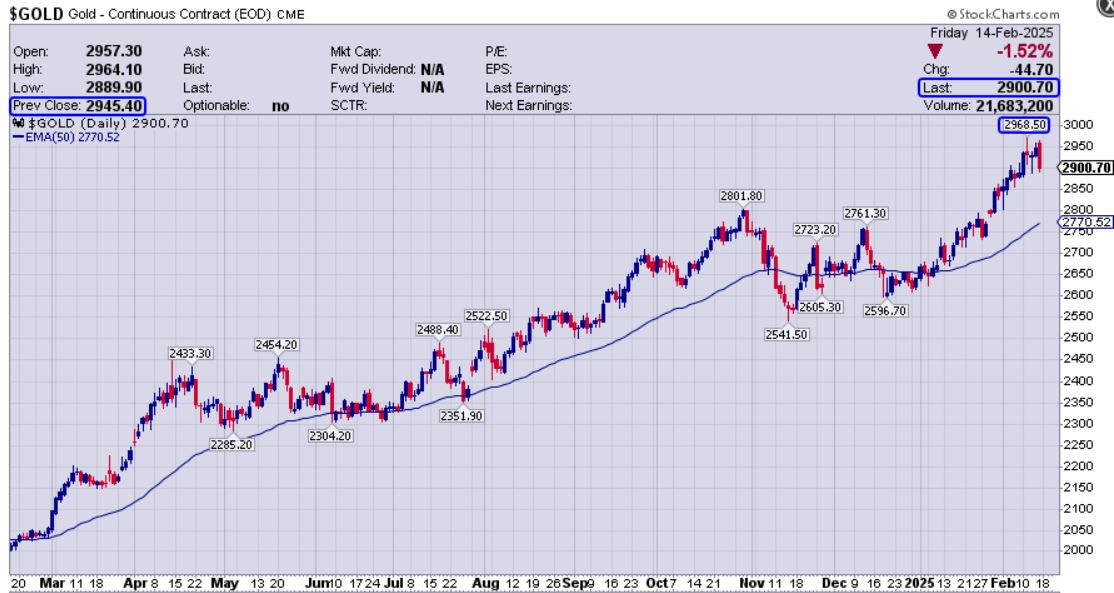
Gold futures continued to make a number of new all-time highs again this last week:
Tuesday tagged a new all-time intraday high in gold up to $2,968.50
Thursday marked a new all-time daily closing high in gold up to $2,945.40
Friday marked a new all-time daily opening high in gold $2,957.30
Gold then fell down hard over the course of Valentines Day, closing at $2,900.70, and causing the PM sector to roll over hard on Feb 14th.
What was lost in all the love fading in PMs on Cupid’s Day was that $2,900.70 was a new all-time weekly high. This eclipsed the pattern of successively higher all-time weekly highs seen the prior 3 weeks in a row. That’s been a strong trend.
Gold is not overbought on the daily with a RSI reading of 63.38, but it is overbought on the weekly chart with an RSI of 73.41. It may need to rest for a bit, seeing pricing consolidate at a lower level before the next blast higher.
The 2 back-to-back indecision candles (long wicks with narrow-bodied candles) on Tuesday and Wednesday could have marked a short-term topping process, especially considering the sharp move down into a large red candle on Friday. That is fine if gold does correct for a while and to be expected at this point.
Gold is also well above its 50-day Exponential Moving Average (currently at $2,770.52). That 50-day EMA (blue squiggly line) is still sloping up higher, and it could keep climbing up to meet pricing as support at a higher level in the $2800s. A pullback in pricing to somewhere around the 50-day EMA would not derail the longer-term bullish pattern or thesis.
If the yellow metal just keeps blasting too much higher, then it runs the risk of this rally going parabolic, with pricing moves too far above its key moving averages. That would not be ideal. It is better technically to make 2 steps forward, then take 1 step back, backtest support,and then take 2 steps forward again, etc…
Let’s have a look at the silver futures daily chart:
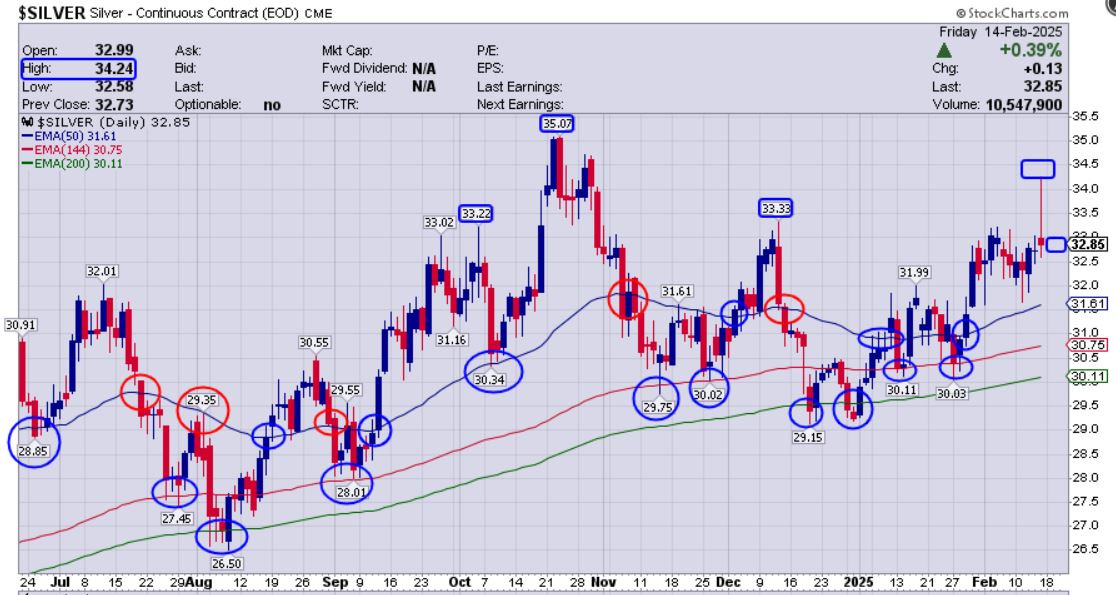
Silver futures made a higher intra-day peak this last week on early Friday morning up to $34.24, but couldn’t hold onto that level. It opened up in North American trading hours significantly lower at $32.99, and then closed down on the day in a red candle to end the week at $32.85.
That move up and back down in silver mirrored the kind of momentum moves we saw play out in gold.
It is worth pointing out, (once again), that silver doesn’t trade based on its industrial component, and most often it is pulled higher or lower in response to outsized moves in gold. While they are different asset classes, and not a mirror match; in general, silver will respect the trend direction and momentum moves in gold, as the prime mover of the precious metals complex.
Silver’s percentage moves are just much more exaggerated, so it can dive down much lower or blast up much higher on big moves in the yellow metal.
However, on tepid market days where there is a grind and not a definitive trend, (or on panic days in the market where gold is acting as a safe-haven), then silver may not always follow suit. Silver doesn’t usually get safe-haven bids on panic news.
The vast majority of the time though, it is the investment demand at the margins, picked up in the future’s market price action, that is the tail that wags the dog. It is NOT the physical supply/demand imbalances silver’s 60% industrial use applications (the dog) that wags the tail on most days… (even though we so often hear commentary to the exact contrary).
Silver futures pricing really respects the key moving averages for both support and resistance. Take a look at the blue and red eclipses on the chart above for where the 50-day, 144-day, and 200-day Exponential Moving Averages act as either support or resistance. Also note the strong follow-through momentum moves (up/down), when a moving average is crossed through with conviction.
I know this factual data can rub some silver bugs the wrong way, as they are convinced the physical markets should move the markets. Look… philosophically I’m in your camp. If markets were logical, then the supply/demand imbalances in the physical markets would and should move the pricing; but that just hasn’t been the case for decades now. Maybe one day that will change, but not today…
Do you want to wait and wait to be right philosophically, on some altruistic principle, or do you want to make money? It is important to trade the markets we are given on the price charts, and not fight the data, wishing it were somehow different. That only leads to the pointing the fingers of blame to try and explain away why it isn’t or shouldn’t be so.
You’ll make better investing decisions and place more winning trades if you simply align with the pricing data on the charts, (even if it is in direct contrast to what you believe philosophically or fundamentally).
I bring up this point, after reviewing silver futures pricing, because this is the one commodity sector where I see the biggest cognitive dissonance between the pricing data and investor expectations and biases. We don’t see it in oil, iron, corn, or coffee.
After 18 years of tracking the price action in gold and silver, and over 15 years trading resource stocks in many commodities (gold, silver, copper, platinum, zinc, uranium, lithium, oil, natural gas, rare earths, etc…); it is the silver sector retail investors that seem to struggle the most with accepting the actual pricing hand we are all dealt, and acting accordingly.
Again, I recognize that this may trigger some dyed-in-the-wool silver bugs. Look, we all wish silver would trade more in alignment with the underlying supply/demand fundamentals for the physical metal itself. I empathize with many silver investors that simply can’t stand how the paper markets get pushed around by bullion banks, hedge funds, and other financial institutions, which is why they abhor the paper pricing schemes. I understand this, I really do… but I’m trying to help you make money and become better traders.
You’ll win more and be disappointed less, if you just suck it up and trade based on the pricing patterns on the futures price charts… as that is what most of the world, be it human or machine algo, is keyed off.
That is the market truth… even if people believe there is a different underlying truth to the physical markets. For investing and trading it is best to swim with the current, versus fighting the market on a daily basis. Again, do you want to be right philosophically and be continually vexed; or do you want to make money trading and investing? Enough said…
Now, let’s take a look at the Copper daily chart:

Is the doctor in?
What we are seeing set up technically with Dr. Copper on the futures chart is what could be viewed as a large W-shaped double-bottom. Actually, there are 2 W-shaped double-bottoms in sequence - a larger one and smaller one.
The larger W-shaped double-bottom starts from last year’s all-time high at $5.199, down to $3.921, up to last year’s peak at $4.79, down to the $4.005 recent bottom at the turn of the calendar year, and is making good progress on heading back higher again thus far in 2025. Ultimately pricing needs to go back up and test that $5.20 area once again, and then exceed it on a daily (and preferably weekly) closing basis, to have the good doctor put on his dancing shoes once again.
The smaller W-shaped double-bottom starts at last year’s peak at $4.79, then goes down to the November low of $4.00s, then goes up to the December peak at $4.335, then goes down to the $4.005 recent bottom at the turn of the calendar year, and then shot up to Friday’s intra-day peak at $4.837.
The only issue is that the $4.837 level was only intraday, and that price didn’t hold into the daily or weekly close. Pricing fell down swiftly to close the day/week at $4.66, getting swatted back down by overhead resistance.
The near-term resistance zone for copper futures is in that $4.70-$4.80 range. We need to see a definitive daily, (and preferably weekly), close above that zone to get more momentum going coming out of the smaller W-shaped double-bottom.
Once that breakout is achieved, then there may be the energy and momentum building to go up and retest the $5.20 level on the larger W-shaped double-bottom pattern. If those technical points are achieved, then copper pricing would be set to really move up with conviction.
The good doctor has more work to do technically, but again, so far in 2025 copper has been in a bullish posture, and pricing is well above the 50-day EMA.
Even though the daily candle was red, that $4.66 Friday close was the highest weekly closing level achieved in many months. That’s bullish. So far so good…and one step at a time.
Switching over to the energy sector, let’s look at the oil daily chart next.
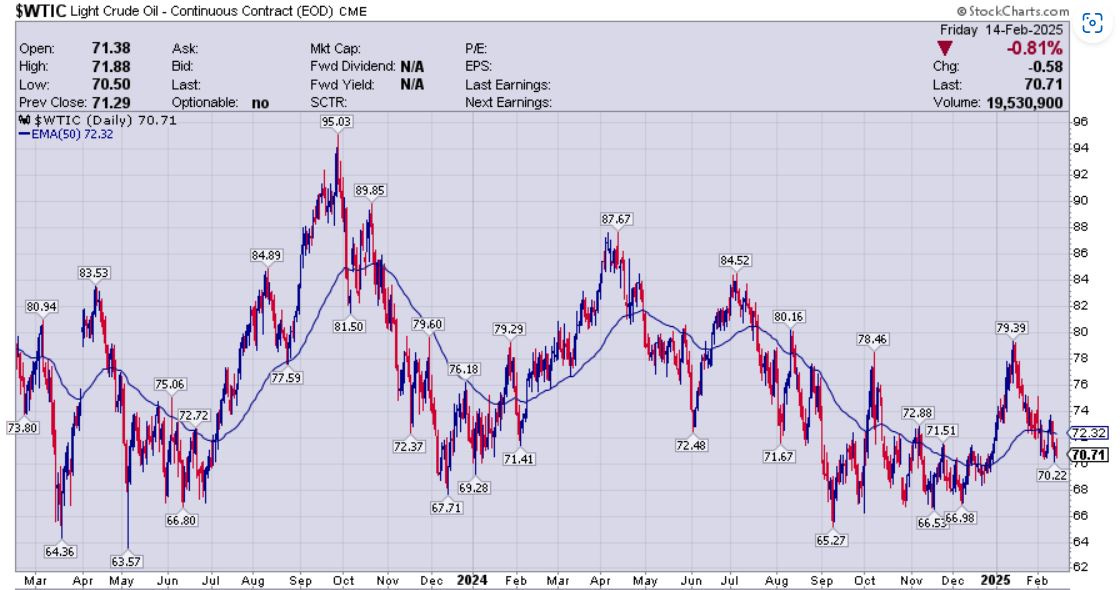
This oil chart is very messy, and there isn’t a solid trend, and more of a channeling sideways to downwards.
Oil prices have been whipsawing investors back and forth for the last 2 years in the broad range of $65 - $85, with a few outlier peaks and troughs.
With the exception of 2 multi-month runs in the middle of 2023, and early 2024, the oil price has spent more time correcting and under pressure.
Pricing has spent far more time under the 50-day EMA, compared to the time it has spent above it, which has been net bearish action.
To kick off this year, we saw that brief price rally in January up to $79.39, but it was quickly reversed right back down again.
Pricing closed Friday to end the week at $70.71, solidly below the 50-day EMA, and towards the lower end of the price channel range.
While there is nothing uber-bullish to report, we may be entering the area (especially if we see WTI prices go back into the high $60’s) where we can anticipate the oil chart whipsaw popping pricing back higher again.
These types of whipsaw range-bound charts do not excite me personally. Compared to the positive pricing levels we’ve seen achieved this year in gold, silver, and copper, I’m just not as enthused with the oil price chart and it is more of a “meh” for me thus far in 2025.
Now, again, if we see a move into the high $60s, then I may add back positions in some of the oil stocks I sold last year to play the trading range, (and will get into a few company ideas down below). Even at current prices near $70 WTI, it is a compelling level to start accumulating traditional energy stocks, for investors interested in getting long the oily names… I’m just not expecting big fireworks until we see either a breakdown or breakout beyond that $65-$85 pricing channel.
Now let’s have a look at the daily price chart of natural gas .
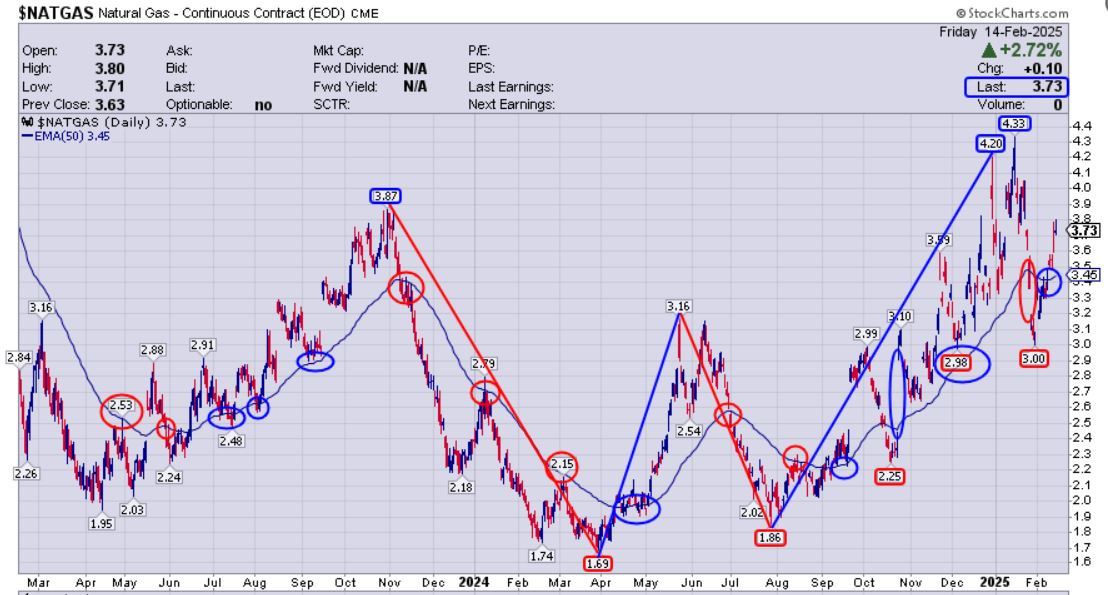
This 2-year daily price chart of natural gas is very volatile, but it is actually a much cleaner chart, compared to what we see with the WTI oil price chart.
Just like gold and silver, nat gas respects the 50-day EMA for both support and resistance, (as highlighted by the red and blue ellipses along the blue line).
Additionally, pricing appears to have made a W-shaped double bottom pattern; starting at the late 2023 peak at $3.87, down to the March 2024 bottom at $1.69, up to the May 2024 peak at $3.16, down to the July 2024 bottom at $1.85, and then up to the December 2024 peak at $4.20.
What is concerning though about this double-bottom pattern thus far in 2025, is that it did go up and make a higher-high in January at $4.33 (which is bullish), but then immediately dove back down hitting a trough of $3.00 in January, breaking down through the 50-day EMA support (which is bearish).
So far in February 2025 pricing has vaulted back up above the 50-day EMA which is short-term bullish, but we still haven’t seen pricing plow a lot higher out of that W-shaped double-bottom with real conviction. That would be the confirming bullish action we want to see coming out of that kind of pattern.
Maybe the big surge higher is still setting up for the next month or two, but the crazy move to the downside, right after making a new slightly higher high, likely caught a lot of nat gas bulls on the wrong side of the trade.
Nat gas is notoriously volatile and extremely challenging to trade, in either the short-term or long-term. This is precisely why it has earned the nickname, “the widow-maker.”
For now, the bulls are still in control; but nat gas needs to clear that recent higher peak at $4.33 to really kick on the afterburners.
Wrapping up, I want to reflect on some of the key takeaways from Michael Campbell’s World Outlook Financial Conference, that I attended in Vancouver a week ago, from Friday Feb 7th through Saturday Feb 8th.

This was a smaller boutique event, but had quality speakers and quality companies in attendance. This is much more my personal preference, compared to the massive hectic human zoo conferences, where everyone is running around with their hair on fire to get to their next meeting. Because it is self-contained in one location, you get more time to really speak with the vendors and other investors, and don’t spend half the event running all over the place trying to find various building or meeting locations.
Most company sponsors that were showcased on the exhibit floor were focused on the resource sector; which was right in my wheelhouse. The commodities discussed most often from speakers stage were mirrored in companies present in oil, natural gas, gold, silver, and copper. However, to round things out, there were also a number of institutional funds presenting, that were focused on aggregating opportunities in commodities, real estate, technology stocks, and even baskets of Canadian stocks. It was informative to see how some of them showcased their unique strategies and core approaches to investing in different segments of the markets. A very nice mix.
Hands down, the strongest segment of resource companies present were those operating in the oil and nat gas sector. That was due to the influence of, Josef Schachter, Publisher of the Schachter Energy Report, who we also feature monthly over at the KE Report. Josef is one of the most well-informed individuals on Canadian oil and gas companies in the industry, and I’d recommend following his research for anyone serious about investing in the energy space.

https://schachterenergyreport.ca/
I personally spoke with all of the Canadian oil & gas companies present at the conference (and was familiar with most of them already). They were all quality companies that I’m considering for my own personal portfolio: Birchcliff Energy, Bonterra Energy, Hemisphere Energy, InPlay Oil, Petrus Resources, Pine Cliff Energy, Surge Energy, and Tamarack Valley Energy.
There weren’t a ton of gold companies, but I did get to catch up with one of the heaviest weighted growth-oriented gold producers in my portfolio:
Calibre Mining Corp. (TSX: CXB) (OTCQX: CXBMF).

They are getting closer and closer to completing construction at their Valentine Gold Mine in Newfoundland, which is going to be a monster producer for them, ramping up the 2nd half of this year. They are still blowing and going with production at their multiple other mines in Nicaragua and Nevada. I remain very impressed with how Calibre is executing operationally and growing production through both improved grade and solid acquisitions. Additionally, they are still one of the most aggressive exploration companies in the gold sector with drill rigs numbering in the double-digits turning across all their projects. They take the mantra “Drill baby drill!” very seriously, and that is why they’ve grown.
For silver, there were a few juniors present, but the one that really stuck out to me was Apollo Silver (TSX.V:APGO) (OTCQB:APGOF). I decided to get a starter position going in Apollo earlier this week as a result of my discussion with director Alex Tsakumis, followed by an interview we had with CEO, Andy Bowering, over at the KE Report.
Apollo Silver is a unique silver stock, in that it has 2 types of optionality. The first is from the ounces defined in the ground at its Calico Project in California. The more compelling optionality comes from the call option on their second massive world-class Cinco de Mayo Project, that they acquired from MAG Silver last year. This value will be unlocked if they can obtain the social license to proceed (where others have been unable to do so). These are the same guys that were behind Prime Mining when they were able to obtain the social license at the Los Reyes project in Mexico, and so I’m taking a flyer here that they are going to be able to do something similar at Cinco de Mayo. The potential payoff is worth the punt.
Apollo Silver - Project Catalyst Overview: Calico Project, Cinco de Mayo Project
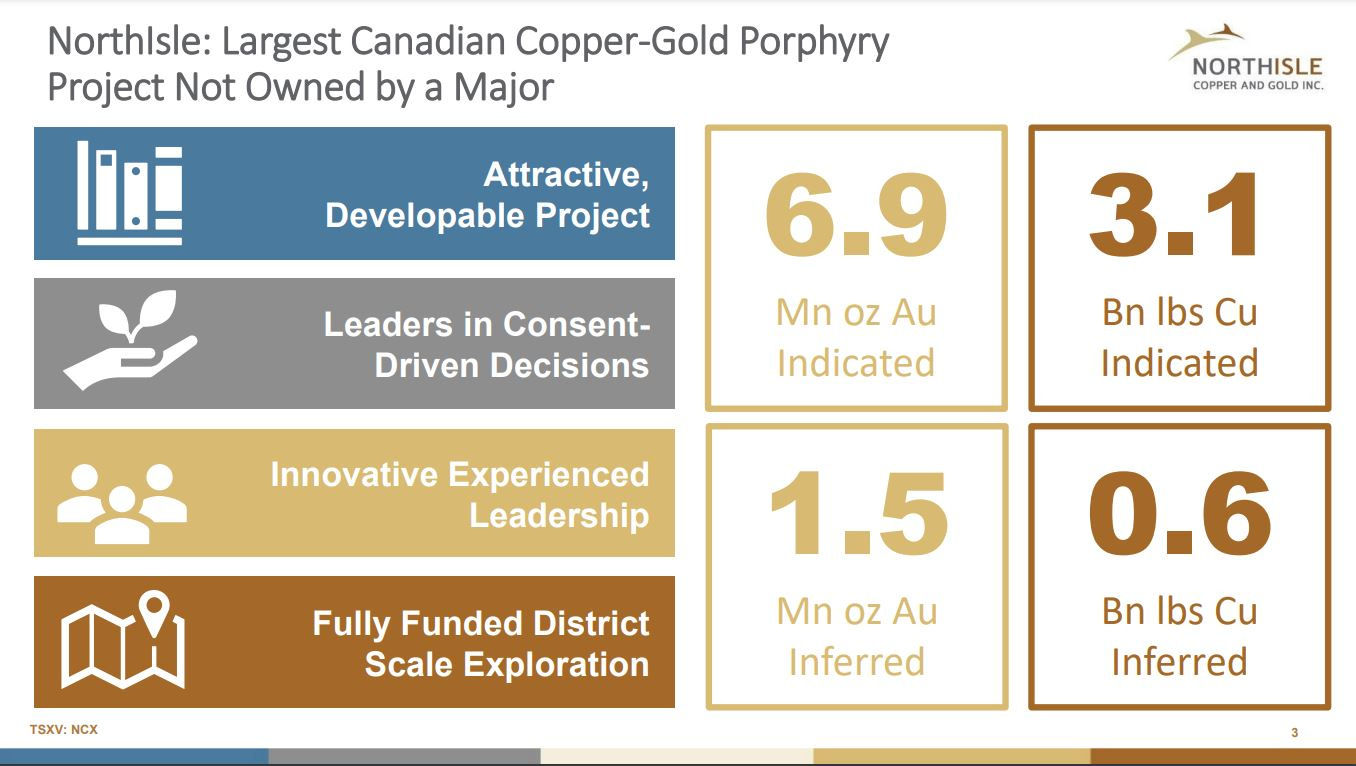
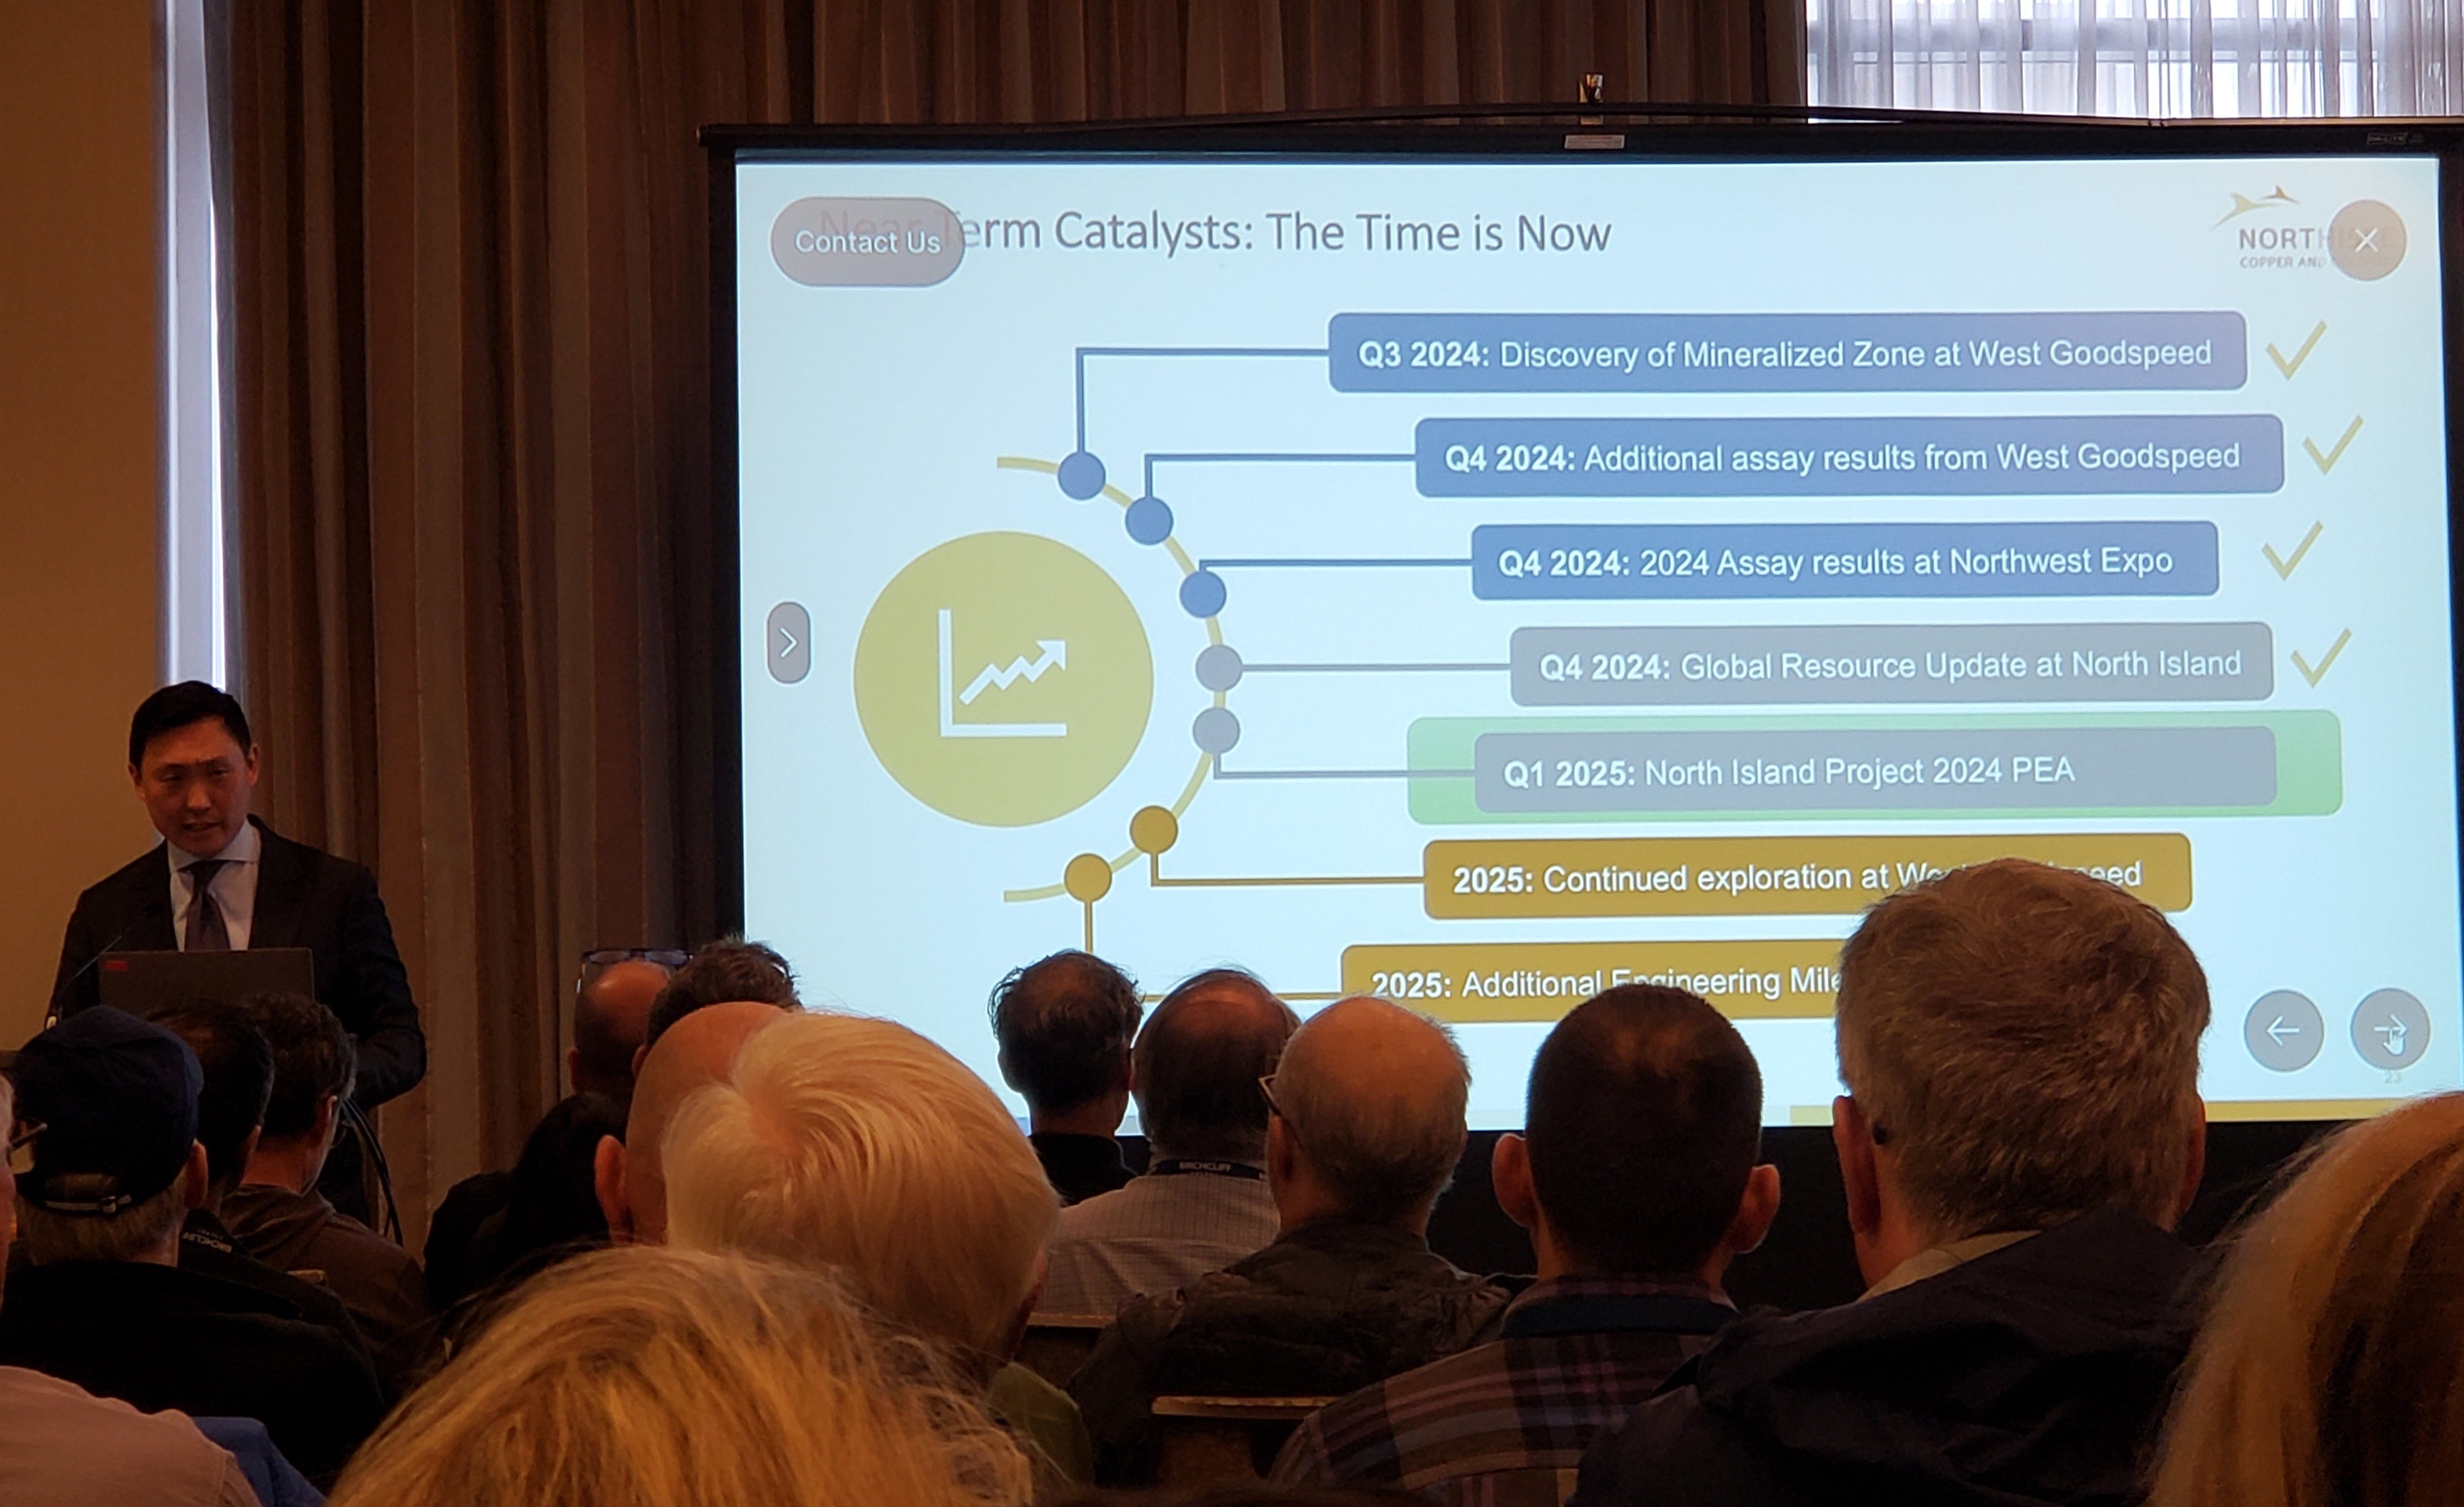
The copper stock that most captured my interest at this conference was NorthIsle Copper & Gold (TSX.V:NCX). CEO, Sam Lee, did a great job of delivering the value proposition at their North Island Project in northern Vancouver Island, BC. The project currently has a resource base of 3.1 billion lbs of copper (indicated) and 6.9 million ounces of gold (indicated); with even more metals in the inferred categories. I don’t own it personally, but feel it is a compelling story, and we’ll be getting them back on the KE Report soon for an update.
I don’t have time to get into to all the topics and insights I heard in the main speaking hall at the event. My main focus at the conference was talking with the companies in attendance, so I didn’t really catch that many of the keynote lectures. However, for those curious and possibly considering attending next year, here is a link to the lineup of speakers from this year’s event:
https://mikesmoneytalks.ca/wofc-speakers-2025/
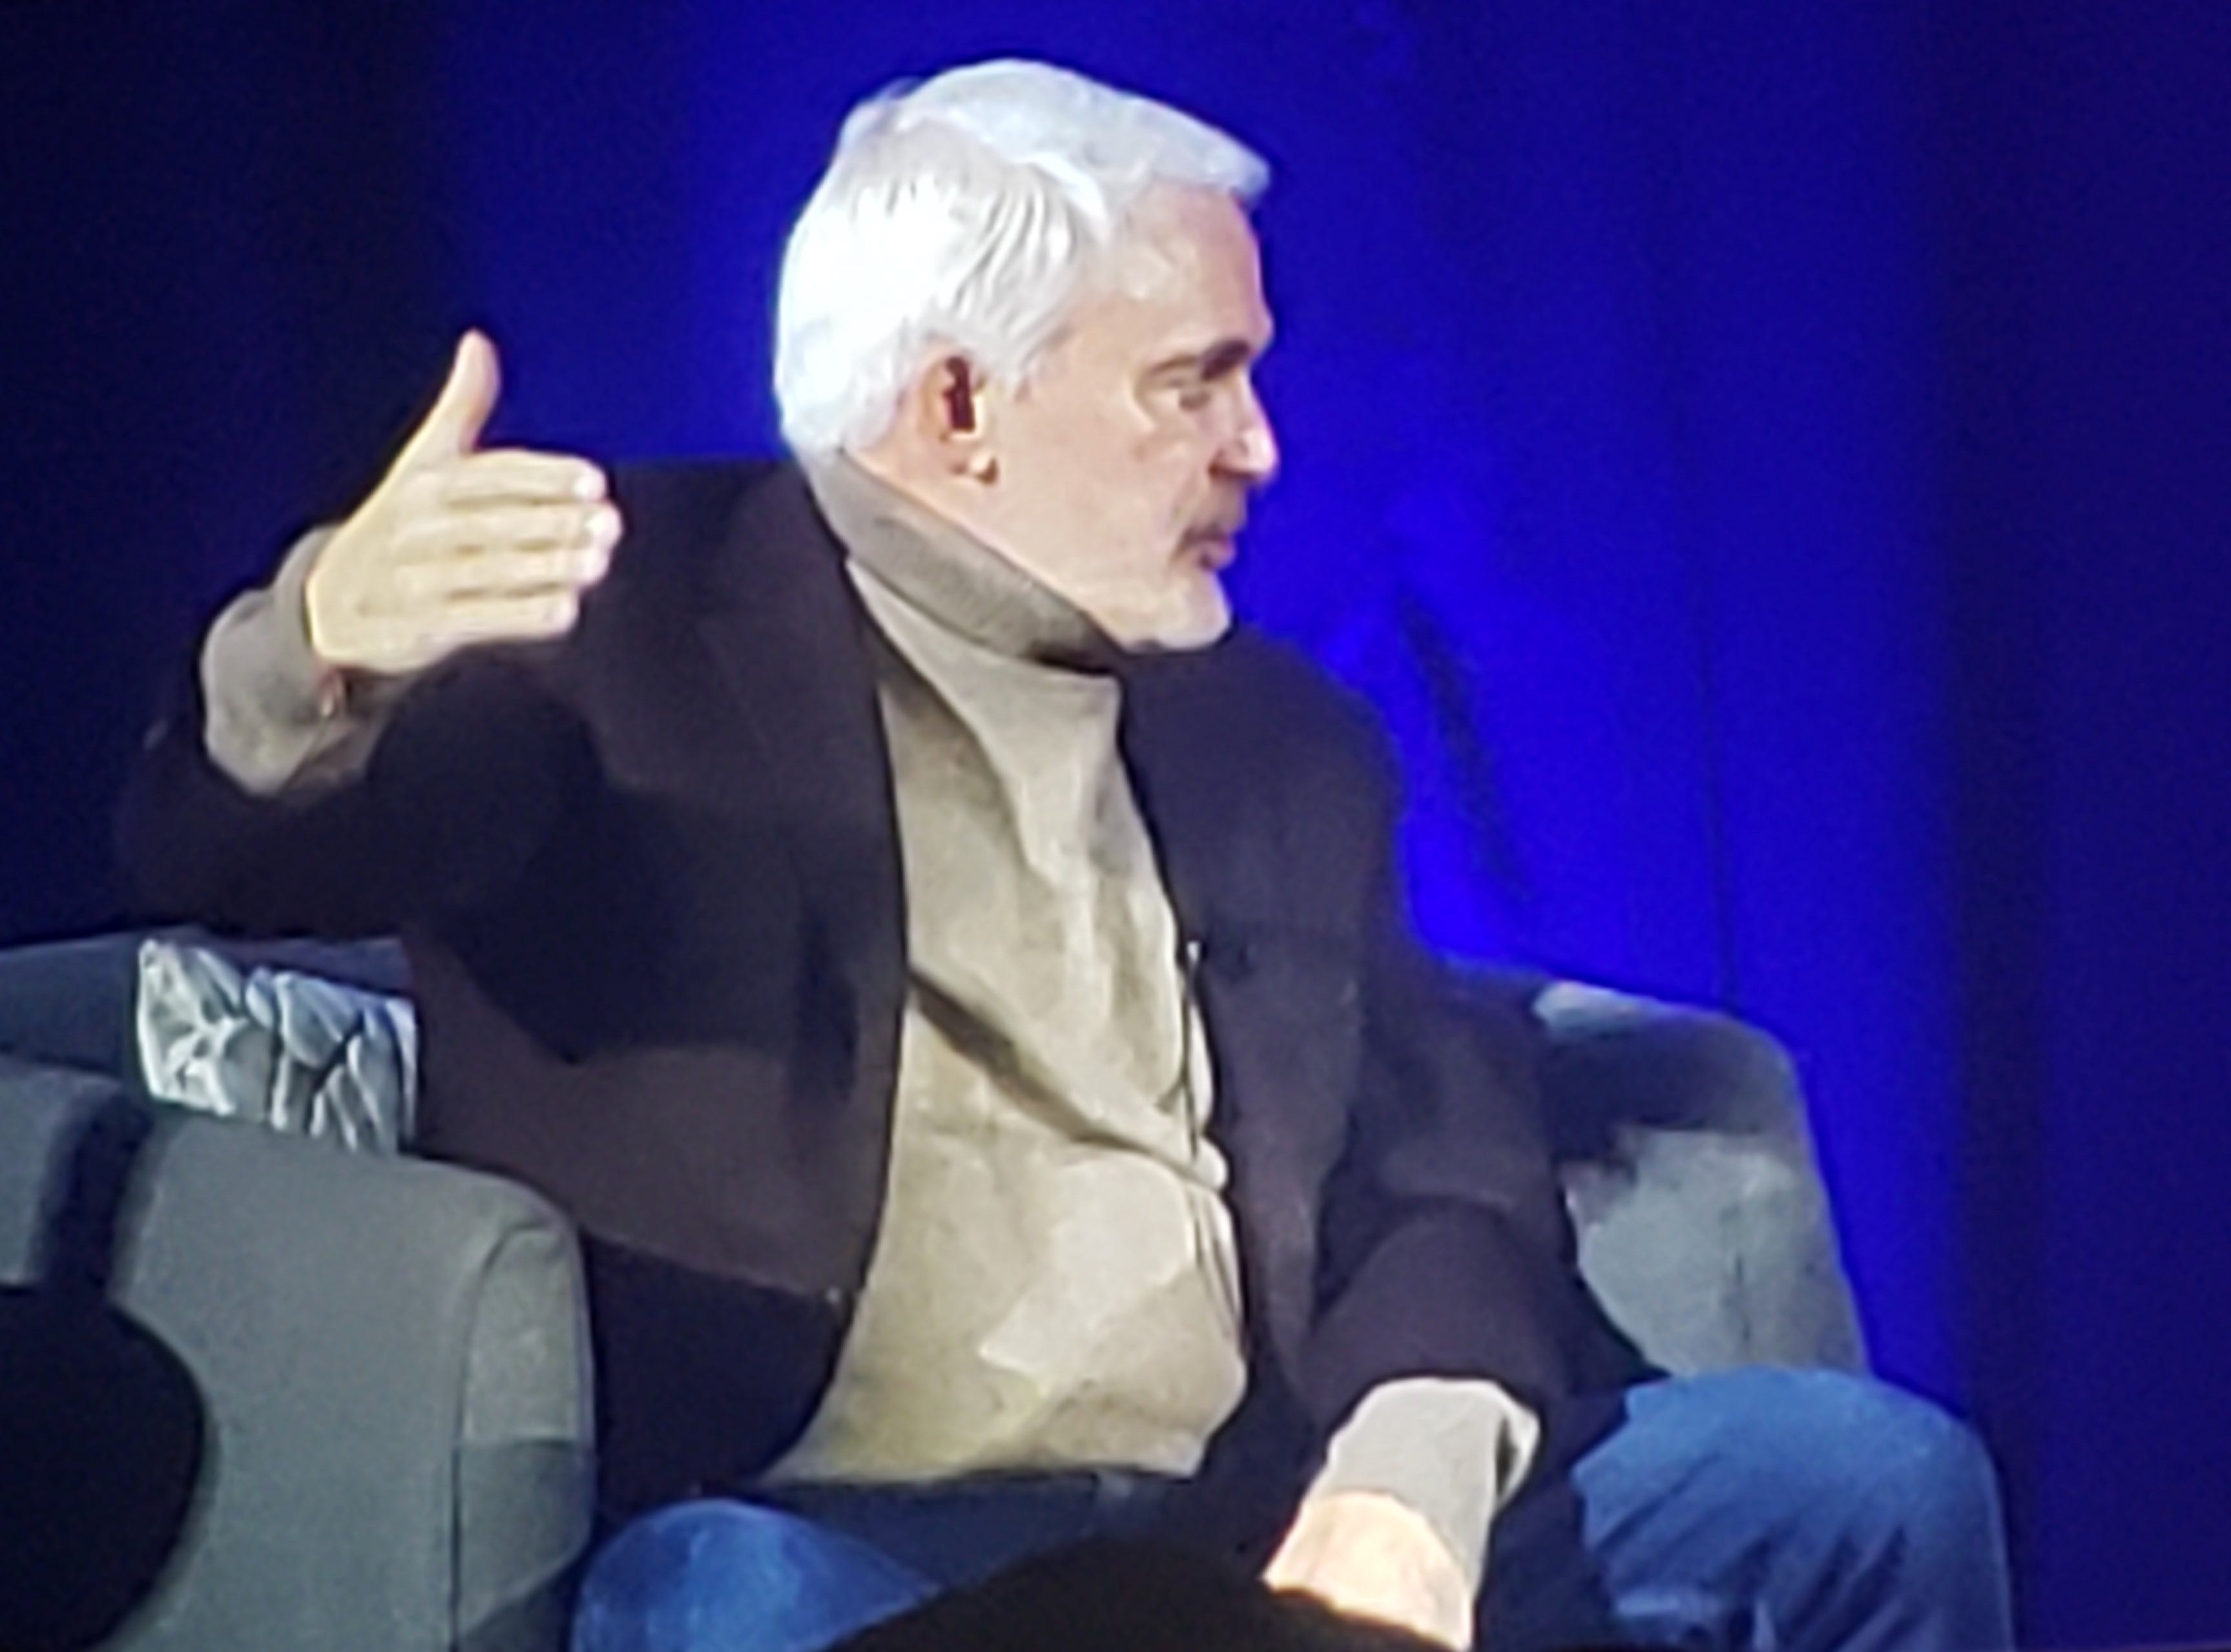
The closing keynote presentation on Friday night was the controversial investing figure, Martin Armstrong. I did attend this talk, and he didn’t disappoint. He gave opinionated takes on the fall of empires, a wild trip down memory lane in global geopolitics, the current nosebleed valuations in US equities, and trends in gold, oil, and real estate. Martin’s talk was funny, disconcerting, and informative all at once.
The 2 keynote addresses that closed up the event on Saturday, featuring Frank Giustra and then Peter Grandich, were really captivating for the audience that toughed it out until the end of the conference. Both of these resource legends spent time discussing the potential ramifications on global trade of the Trump administration’s approach to tariffs, focusing in particular on what it meant for Canada and US relations, potential effects on inflation and business in both countries, and how this was fueling more market uncertainty and more buying into gold. They also unpacked many best practices for investing in mining stocks, how they view jurisdiction risk, permitting, optionality, and valuations within the sector.
Frank Giustra talking candidly from the World Outlook stage.
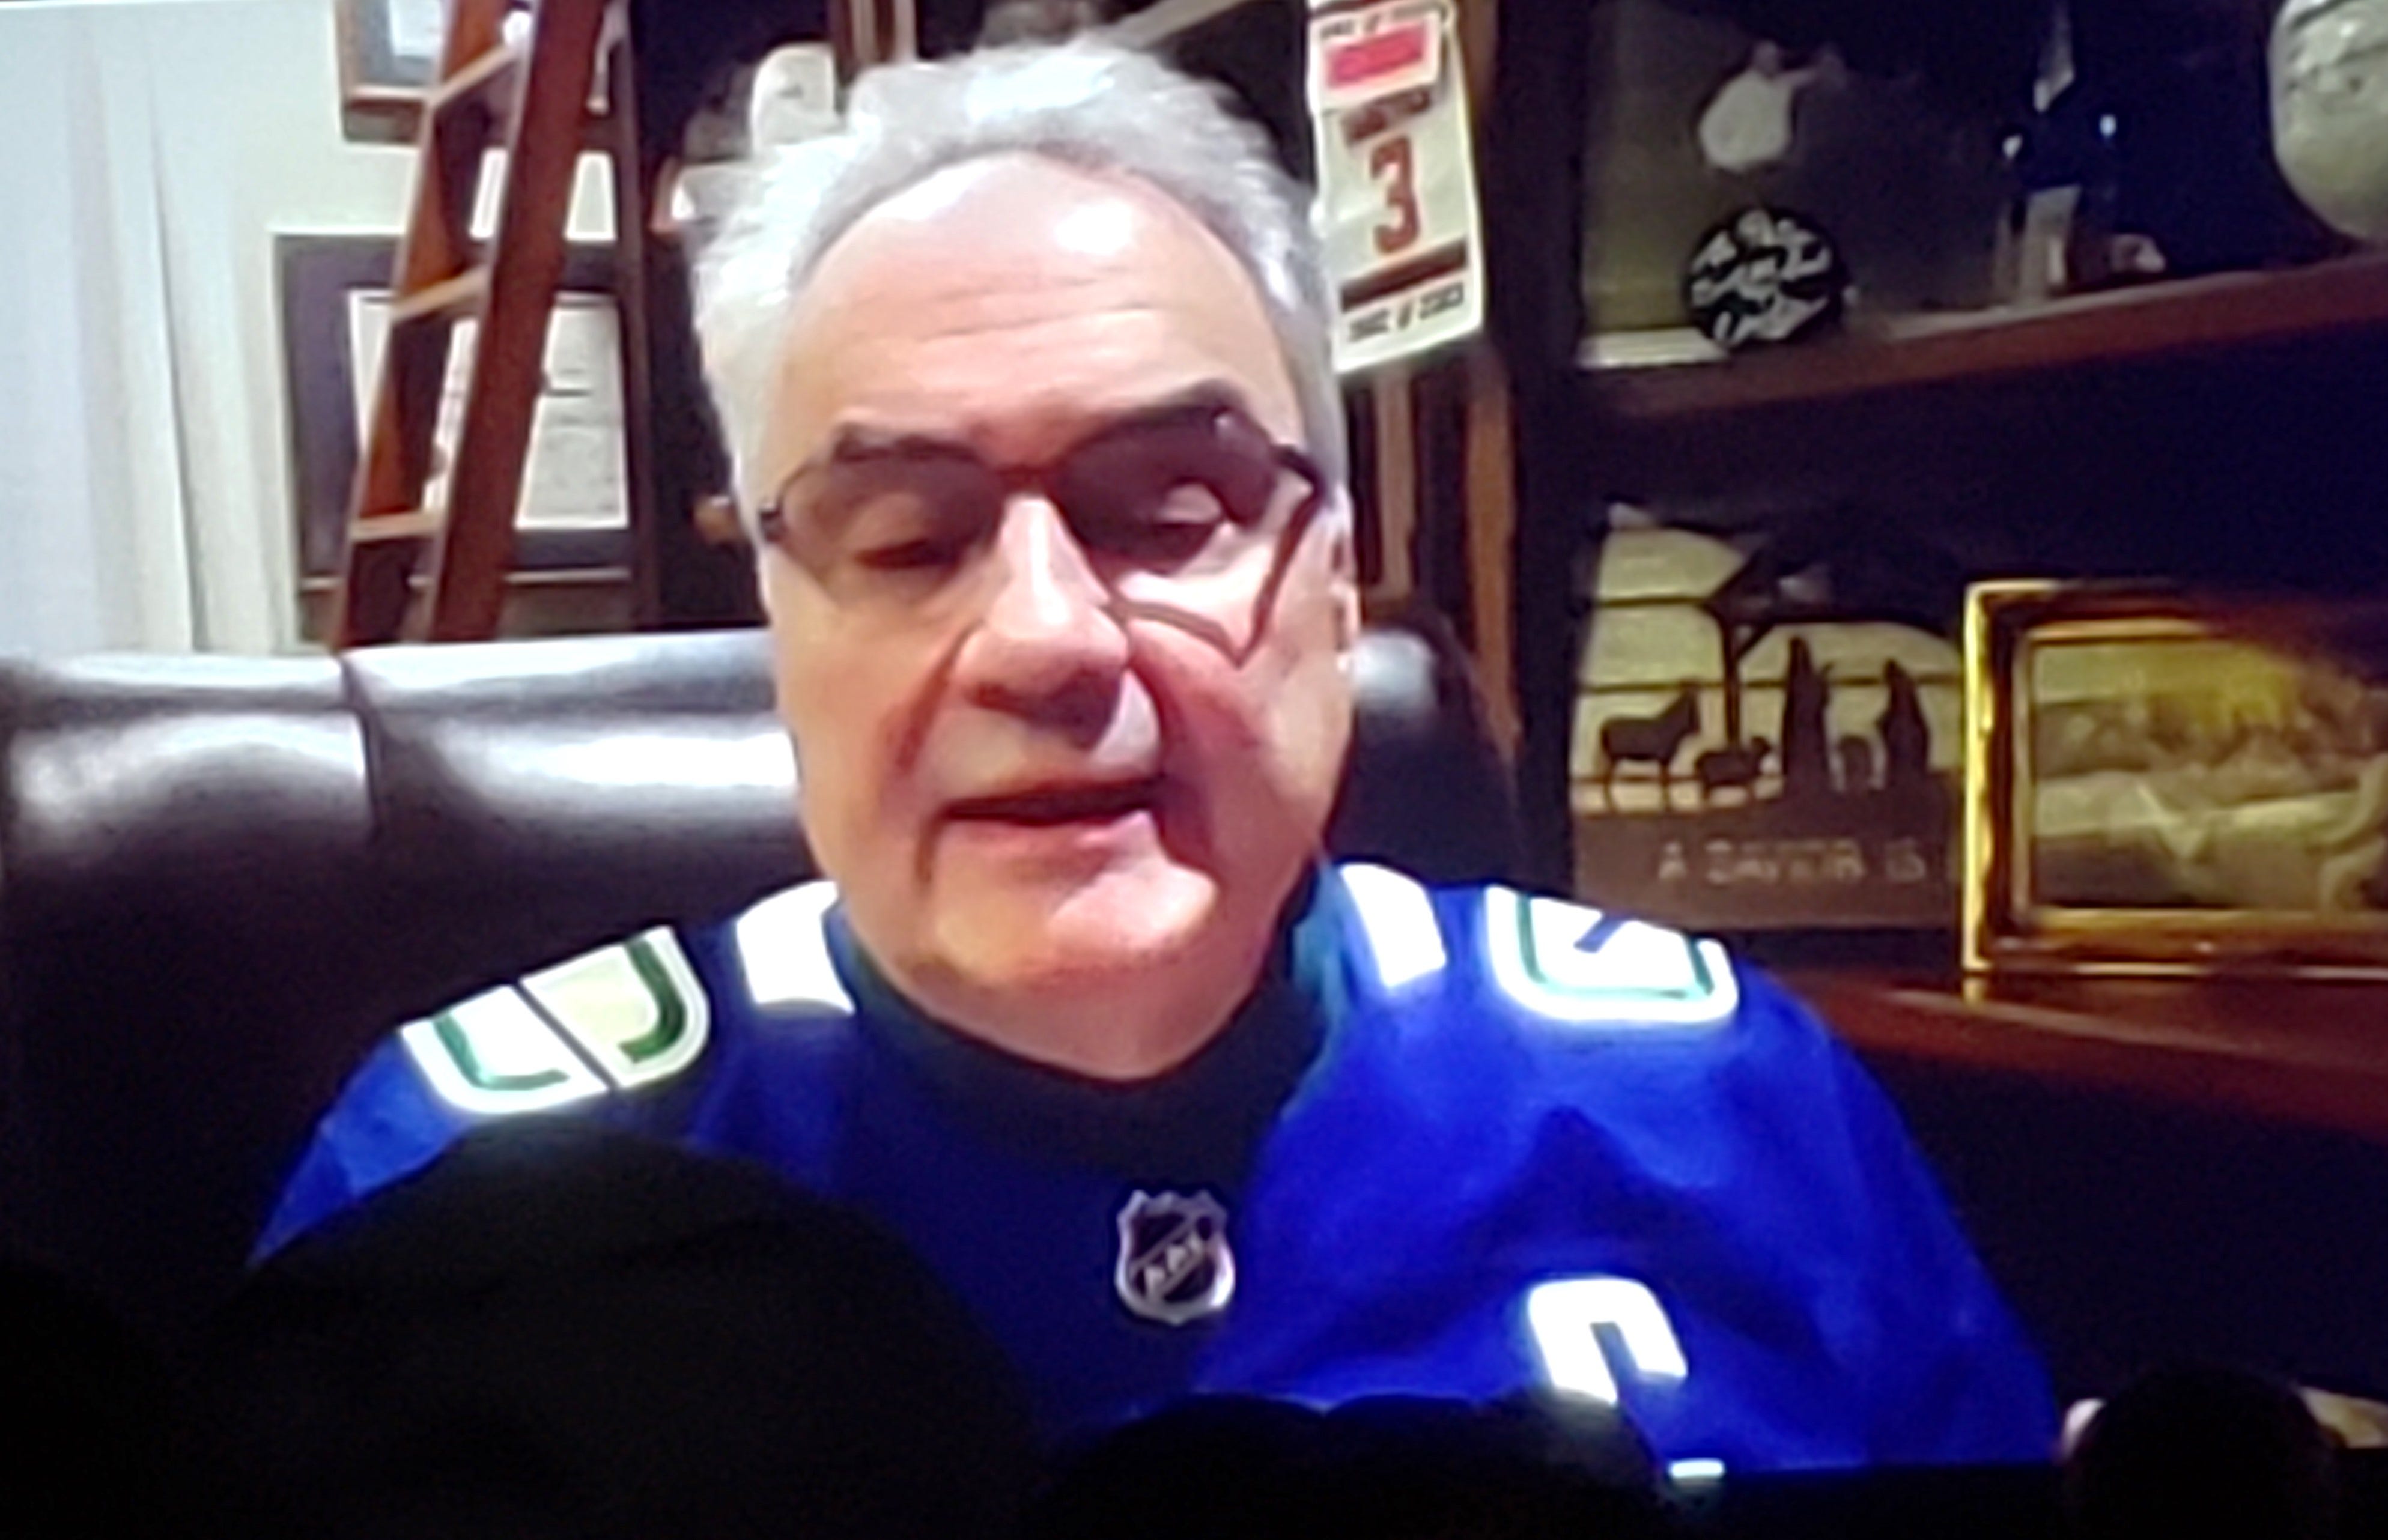
Peter Grandich appeared via video monitor in an emotional swan song, as one of his last scheduled conference appearances before retirement.
Well, that wraps us up for this week in review, and thank you for reading.
May you have prosperity in your trading and in life!
Shad