


Gold Price Makes All-Time Highs On The Monthly and Quarterly Closes
Excelsior Prosperity w/ Shad Marquitz (03-31-2025)
Today on March 31st, we saw gold futures make all-time highs on the monthly and quarterly close, finishing Monday’s session at $3,150.30.
I’m pretty annoyed with Stockcharts at this point, because for the last few trading sessions, when almost every other platform has moved over to the June futures contract last week, for some reason they are still stuck on the March contract. It is just a shame, because this was such a critical monthly/quarterly close for the yellow metal. What is also disappointing is that the pricing charts on Stockcharts are not going to display the right price levels for the last few trading sessions even long after this moment. On almost every other platform, gold has been north of $3,100 since last Thursday March 27th. With all of that Stockcharts remorse noted, let’s move on…
Because this is an important closing moment, here are some charts from other platforms showing the price action. Since they’ve already rolled over into Tuesday’s session, you’d need to look down below the chart to the previous close and will see it noted as $3,150.30
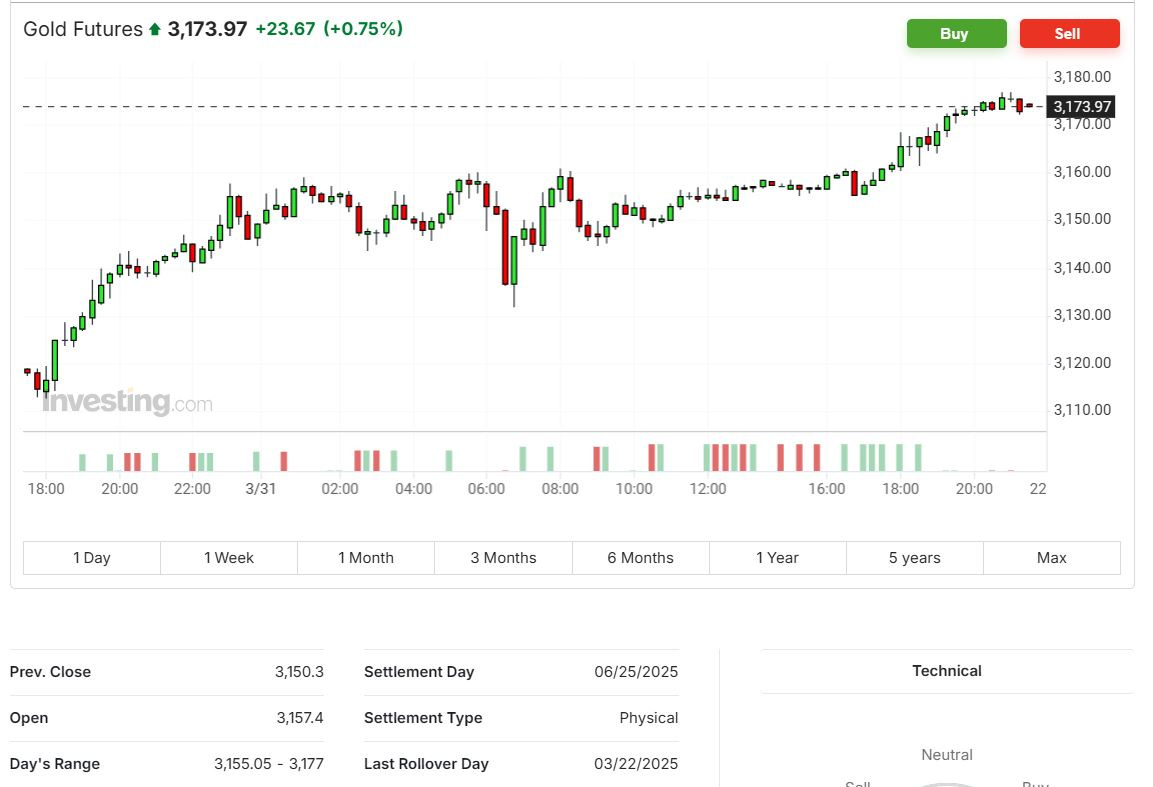
You’ll see that same number of $3,150.30 displayed on the monthly chart below, from Investing.com, from the previous close of the prior monthly candle (March).
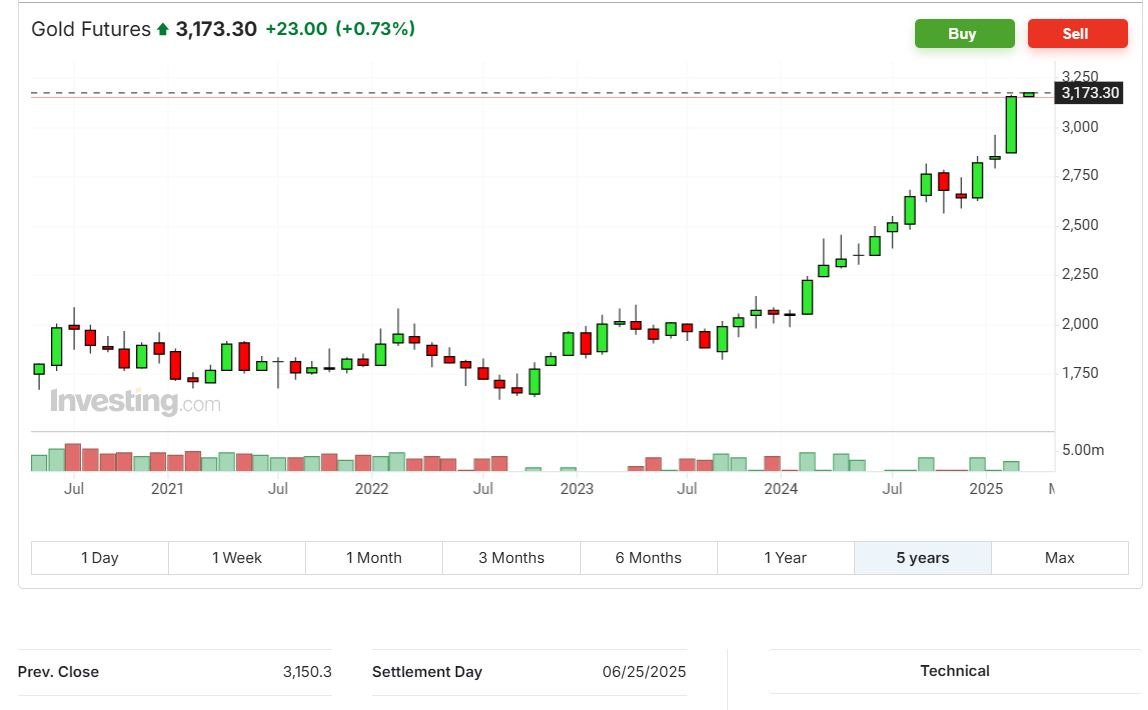
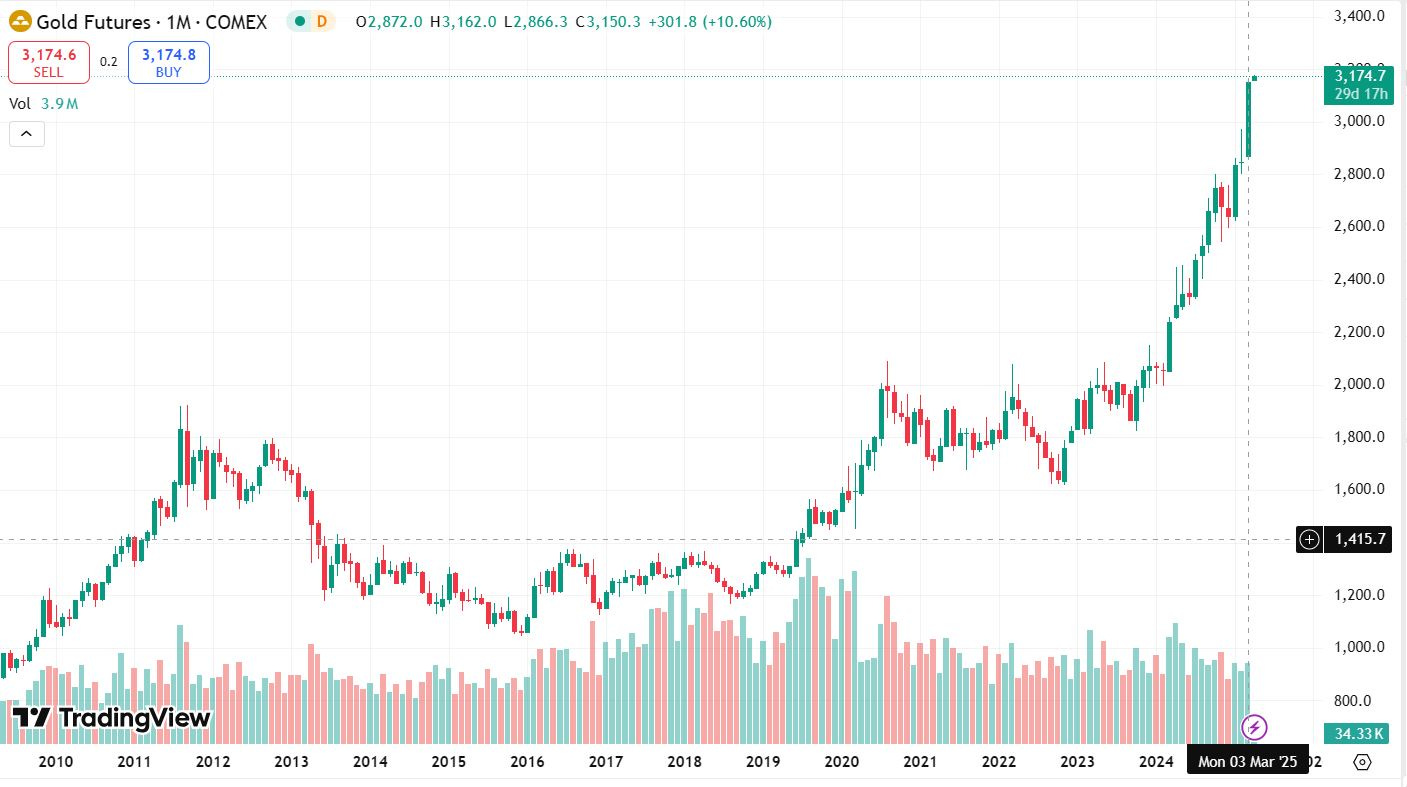
Just for a confirmation of that closing number, here is the monthly Gold futures chart from Trading View and you can see the tiny numbers on the top of the chart with the “C” (closing price) for the prior monthly candle, that ended on Monday March 31st, was also $3,150.30. We can also see on all these charts that the gold futures price is trucking even higher on Tuesday’s session in the $3,174 area at the time of this writing. This chart is starting to go parabolic… and may need to cool off for a while.
For those that prefer the spot gold price, we can see that even there the physical gold prices broke up to new monthly and quarterly highs, closing at $3,123.72.
In the next trading session that is underway physical gold is up at $3,142 so also still blasting higher. {I guess all those average people that were scoffed at for buying physical ounces of gold at Costco last year around $2,000 - $2,100 did quite alright on their purchases, and it looks like they’ll be the ones that get the last laugh}
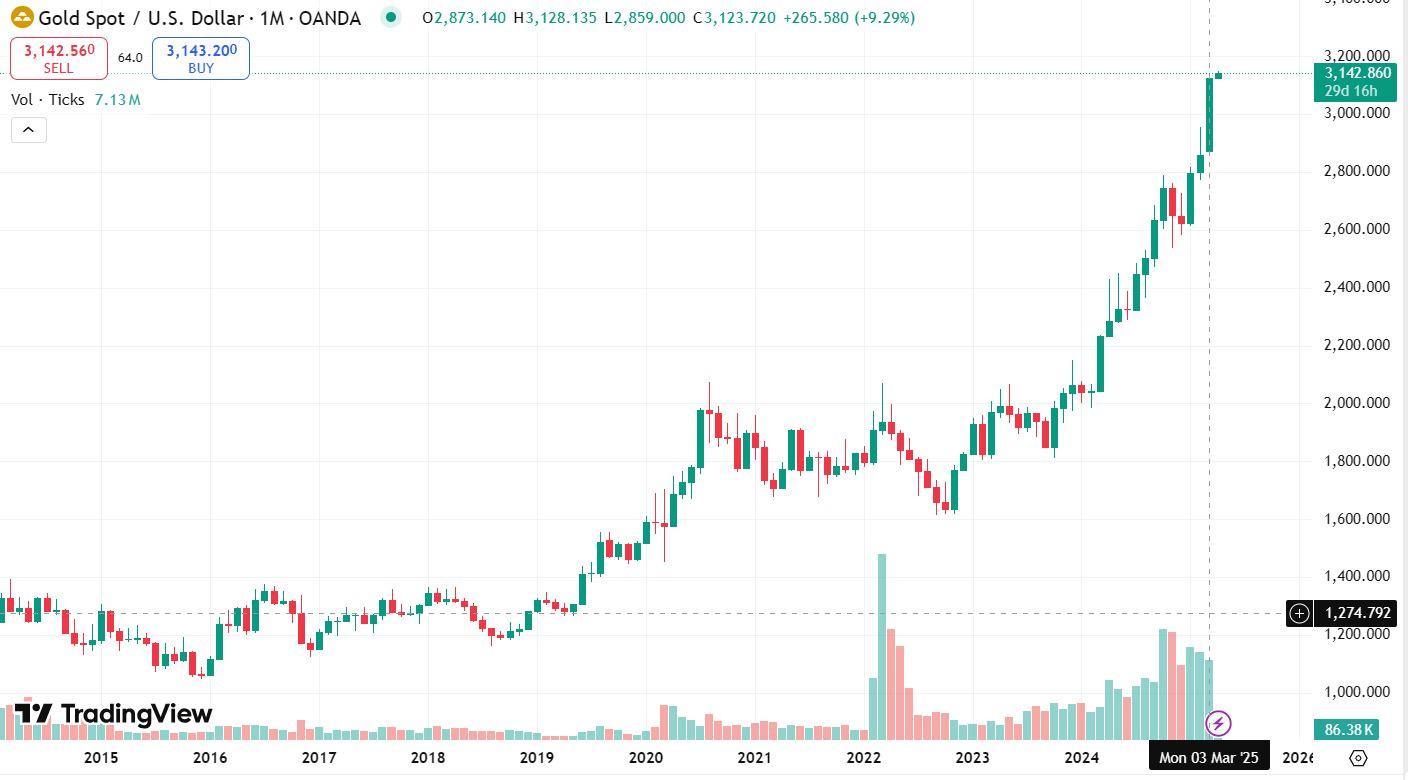
OK, so I think we’ve established that the gold chart has been a juggernaut for some time and Monday’s close was historic.
Now let’s pivot over to the gold equity ETFs and see how they fared on such a pivotal day.
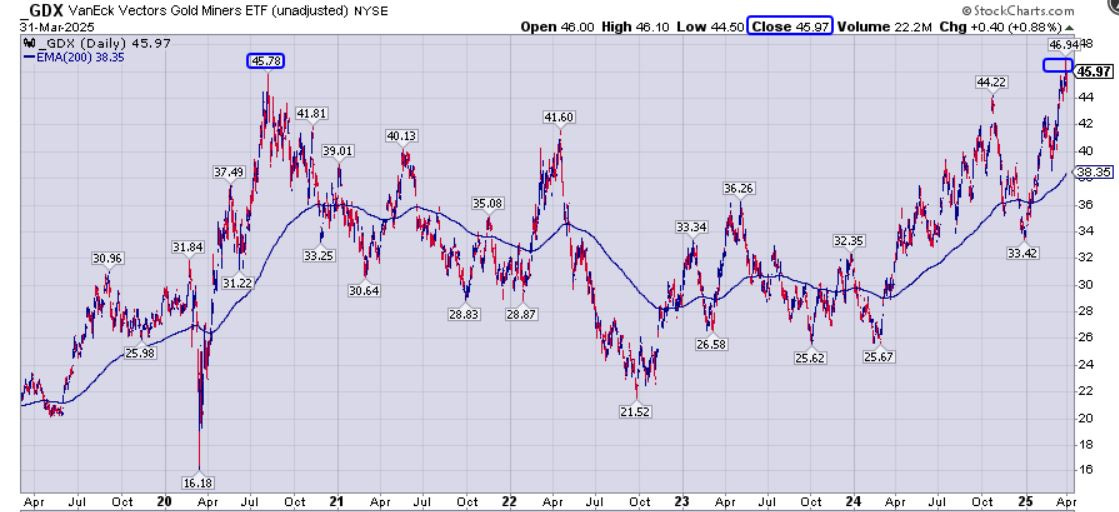
I’m happy to report that the VanEck Vectors Gold Miners ETF (GDX) finally made a closing high at $45.97 on Monday March 31st, 2025; just 19 pennies above the 2020 peak of $45.78.
For a frame of reference, that last peak in GDX, back in 2020, was happening in a backdrop where gold made it up to $2,089. Now over 4 years later, and with gold over $1,000 higher at $3,150, the GDX finally made a marginal higher-high on a daily closing basis. That’s kinda lame… At least that is a more significant close on the monthly and quarterly charts; however, as noted in prior articles, this has been pretty underwhelming price action in this most widely followed gold miners ETF.
Imagine if we took a time machine back to speak with precious metals investors in the summer of 2020, as they were all locked down in their homes, and told them that in handful of years gold would definitively break $3,000 and close Q1 of 2025 at $3,150…. Most of them would have expected that the GDX would have finally blown past the 2011 high of $66.98 and up to new heights.
If we shared with them: Sorry, no the GDX will essentially be at the exact same level it hit in August 2020 of your time, when gold breached $2,000 and got up to $2089…. I image that most of them would be scratching their heads in confusion. (That’s because this GDX price doesn’t make any sense)
We heard from sector pundits for years that the reason gold stocks were underperforming gold in 2021-2023 was because margins had contracted from their record levels over $800 in 2020 and were back in the $400-$600 level.
That explanation never really passed the smell test, because back in 2016 and 2011 those were the exact same margins and yet back then most stocks were at substantially higher levels. The rally in 2020 didn’t even eclipse the 2016 or 2011 rallies in most PM equities when it achieved those record margins. Regardless, that is what the talking heads in the PM sector parroted around to each other and investors at conferences, in interviews, and over phone calls.
OK, well in the latter half of 2024, when margins for gold producers shot up to $1000+, to the highest levels ever witnessed, then why wasn’t the converse true? Why didn’t GDX, GDXJ, and the whole swath of gold equities shoot up to their highest pricing and valuations ever then? Come on it’s record margin expansion!
Sure a few of the best-in-class stocks like Agnico Eagle or Alamos Gold did… (but the vast majority of gold stocks clearly did not).
Currently, when most companies have $1,200-$1,600 All-In Sustaining Costs, and gold is at $3,150 (a delta of $1,950 - $1,550 for margins), then why in the world is the GDX not up at record levels right now? It makes no sense.
If was truly as simple as just margin expansion, then that would absolutely be the case, because we’ve never seen margins this big; but that is just not it… It is as just as untrue today with record margins, as was the rationale for the large underperformance of gold equities for years being pinned on the scapegoat of margin contraction, which was likewise “not it.”
Dilution may be a factor but it really doesn’t explain it away either. Look, much of that dilution in the senior gold producers was to make acquisitions, develop new mines, and grow their resources. Newmont in 2016 and 2011 hadn’t even acquired either Goldcorp or Newcrest yet, so yeah, there’s been dilution, but the company has completely reinvented itself. Barrick hadn’t acquired Randgold yet. Agnico Eagle hadn’t acquired Torrex or Kirkland Lake or part of Yamana’s assets yet, etc…. They’re totally different companies now.
No, there is something very odd and very different going on with this PM bull market. As a general takeaway, these gold equities are not ripping higher as a group to record high prices, and nor have they been leveraging the moves in the metals in the bigger picture and over larger periods of time. The rising tide of record gold prices the last year has not been rising all boats… nowhere close…
Sure, since the beginning of 2025 the gold stocks have been leveraging the move in gold, but that is coming off of tragically low valuations the end of last year that were comical in nature. If they didn’t start to catch up soon, we’d have had to pull the plug on the whole sector.
There has been a lack of sustained bullish sentiment and momentum in the gold equities for years now, but there are some green shoots lately.
Just the fact that the GDX barely limped across the finish line today to make a marginal higher high than just the 2020 peak is quite disconcerting. That’s not the kind of outperformance most investors would have anticipated with this pricing backdrop in the yellow metal.
The good news is that with gold prices raging higher all year thus far, then it means the Q1 earnings that get reported in late April through mid-May are going to be substantially higher with an average gold price of $2,850-$2,900 (a couple hundred bucks higher than the average gold price of $2680 in Q4 of last year).
Those margins and gold producer earnings will stand in stark contrast to the US general equities that have had a much weaker Q1, and the divergence in performance will become “Too Big To Ignore.”
Even generalist investors that couldn’t spell gold last year, will have to sit up and take notice and ponder if they should possibly have a little exposure to the gold sector. These record prices in gold will finally have to be acknowledged by even the most entrenched PM bears and uninterested generalist investors.
The key thing to consider is that gold equities actually track the pricing action in silver much more so than gold.
Silver tracks the speculative aspect of the precious metals sector, even despite all the narratives around its industrial use case. Take a look at just how tight the correlation between GDX and Silver is on the chart below. Uncanny eh? Or is it…?
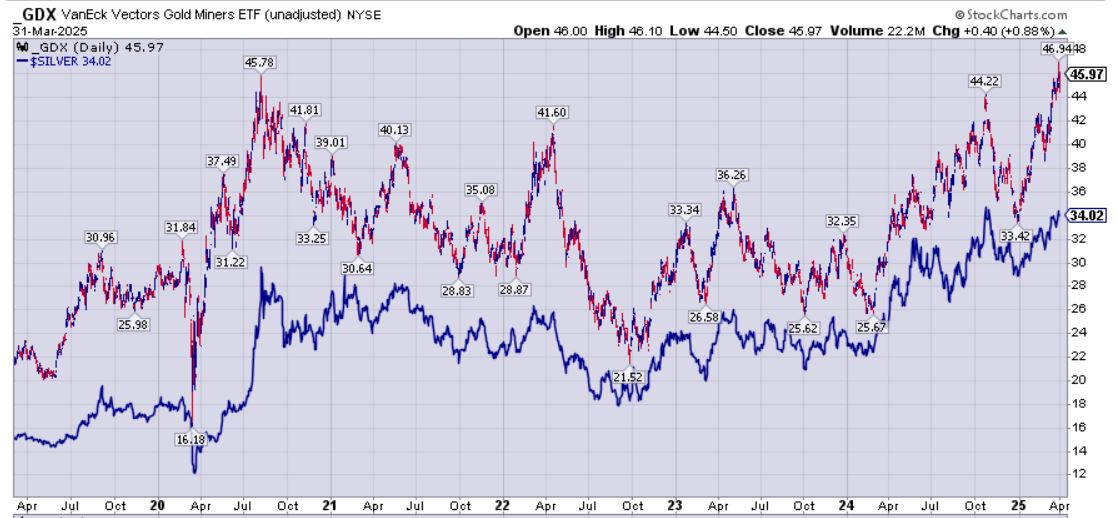
It doesn’t take a rocket scientist to ascertain that if we want to see the gold miners inside of the GDX break out in a meaningful way, then we are going to want to see silver break out in a meaningful way. Gold could go to $3,500 or $4,000 and while it will have some impact on some top gold equities, it won’t really matter to the rest of the pack if Silver can’t get its groove on and blast up in the $40s, $50s, and beyond.
Over at the KE Report today, we had a lively conversation with Craig Hemke, editor of TF Metals Report, where we unpacked many of these very topics.
Craig Hemke – Gold’s Run to $3,150 and Why Selective Stock Picking Is Key
Craig reviews that the GDX continues to lag, weighed down by large-cap underperformers like Newmont and Barrick. However, many individual gold and silver stocks have delivered outsized gains. Craig emphasizes this is a stock picker’s market, not a time to rely on passive ETFs.
We also discuss:
How Q1 earnings could finally spotlight the widened margins across producers.
The divergence between precious metals and broad markets (with the S&P down ~10% since February).
Why silver’s lag is mostly due to heavy futures positioning, despite strong physical demand.
Whether gold’s parabolic move requires a healthy pause—or if momentum will keep building.
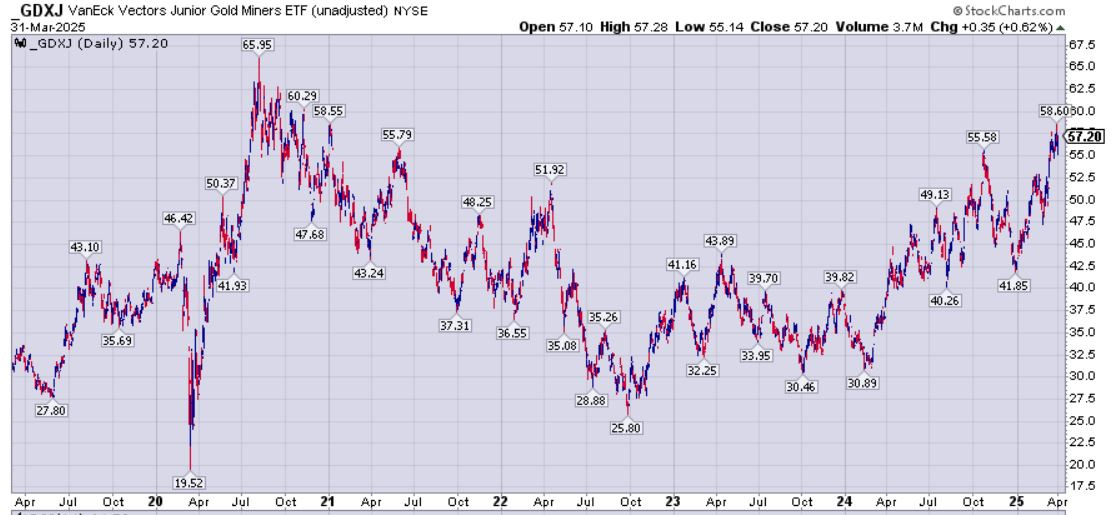
While I completely agree with my buddy Craig on all points he makes in our conversation, there is more going on with the underperformance of the gold equity ETFs than just Newmont and Barrick’s underperformance. I agree that they have been laggards, but they aren’t weighted like that in the GDXJ, and in fact, some of the better mid-teir gold producers like Alamos, Pan American, B2Gold, IAMGold, Harmony Gold, and Evolution Mining are the most heavily weighted names.
Well fasten your gaze on the GDXJ chart below, and make note that even at $3,150 gold it has still not even eclipsed it’s 2020 peak of $65.95, much less the 2011 high about 3x higher than where it closed today at $57.20.
So, said another way, the convenient scapegoats of Newmont and Barrick don’t begin to explain away the underperformance of the GDXJ because that is not why it is underperforming worse than GDX. Again, something else is going on here and it involves sentiment and pricing momentum.
All in all, the Q1 expanded margins and earnings will help, and putting in some higher levels above the 2020 peaks will help; but ultimately we need to see sentiment improve, and that means we need to see silver blasting much higher.
Until then, it truly is a stock-pickers market, not a dart-throwers market. We’ll continue to review companies that can and are providing that extra torque here in this channel, so stay tuned for more tantalizing trade ideas in future articles.
Thanks for reading and may you have prosperity in your trading and in life!
Shad