
Embracing Volatility Part 4 – Spooktacular Resource Carnage In The Deep Red
Excelsior Prosperity w/ Shad Marquitz (10-31-2025)

Happy (belated) Halloween! We are back with one last spooktacular segment focused on embracing the volatility and carnage in select areas of the critical minerals sector.
Then we will be returning back promptly to updates on gold, silver, and copper.
In the spirit of the holiday, this has been an absolutely horrifying week for a number of critical minerals resource stocks. Mr. Market has brutally slashed share prices until we’ve finally seen the proverbial “blood in the streets.” Instead of screaming in terror though, we’ll review the emerging trading opportunities hitting the screen.
We’d seen blistering moves higher for many months in critical minerals stocks, but then over the last few weeks the corrective moves and the inevitable market pullbacks came for the rare earths, tungsten, and antimony stocks.
We’ve already explored reasons for this investing theme for the first 3 parts of this mini-series, so we won’t rehash every aspect leading up to this. This article will provide a very brief update of the fundamental lay of the land, but also question the prevailing media narrative about how much things have actually changed in practice.
Let’s wrap up this series by diving into these deep red charts. We’ll look technically at a number of select stocks, that have been absolutely murdered by the market. We’ll also see if they can make like Frankenstein and come back to life with some added energy.
So, let get into it…
For the last 2 weeks, there has been a steady stream of US trade agreements news that often specifically cited future supply and deals around critical minerals. While the big story was the US/China trade deal, and the 1-year truce on some fronts, there were still other trade deals announced with Australia, Vietnam, Thailand, Cambodia, and Malaysia.
These ancillary agreements outside of China were viewed as constructive for future supply across a range of critical minerals; and thus, related resource stock prices pulled back down in corrective moves, well in advance of the meeting of Trump and Xi.
There is already a recency bias effect starting to shape media coverage of this sector, making all the moves in this sector solely based upon the recent news on the US/China trade deal. Not surprisingly, the market has already ‘memory-holed’ all the other trade news, completed with 5 other countries, with regards to critical minerals, that already shifted sentiment and action in the markets for the last 2 weeks.
These aforementioned trade deals were mostly lacking in the specific metrics and just what kind of impacts are realistically being proposed. The question remains of just how many of these critical minerals can be supplied to the US over reasonable timeframes? Nobody really knows this answer, and yet the markets didn’t wait around to figure any of that out. Skittish investors sitting on big profits simply sold the news, and then selling begat more selling.
Not one of these new agreements really changes the US imperative to delineate, develop, and produce domestically a range of critical minerals; like rare earths, or any of the many other strategic metals that China still has a stranglehold on.
The 1-year trade deal truce between the 2 largest global economies specifically mentioned that China would pause its rare earth export rules from October, and so prices in many critical minerals stocks cratered (even ones that weren’t rare earths like antimony, tungsten, tantalum, gallium, indium, etc…).
So, does this solve all the supply demand concerns then? (No, clearly it doesn’t, but markets can be irrational longer than one can stay solvent).
China has put in place an export permitting regime that it can tighten or loosen as needed, so we’ll see how long these export restrictions really last.
Deal between the U.S. and China is undoing damage from a self-inflicted trade war - The Associated Press - October 30, 2025
With all of that geopolitical trade news as the backdrop, let’s reflect on what really changed here in the big picture.
China is rolling back its rare earth policy to pre-October levels, which was already restrictive, and with the caveat that it can tighten or loosen the export controls regime at any point.
OK, so we have deals with Australia, Cambodia, Thailand, Malaysia, and Vietnam, but there are no quantifiable measures with regards to how many critical minerals or in what quantities will flow into the USA.
In reality, this did nothing to solve domestic supplies of a wide swath of critical minerals, nor did it do anything to help with the refinement, processing, and separation of these strategic metals here in North America. We just went back to pre-October conditions, and so the heavy market sell-off in the rare earth stocks seems quite short-sighted.
Let’s now have a look at a lot of the rare earth stocks to see the “blood in the streets” and the pricing crashes in the latter half of October.
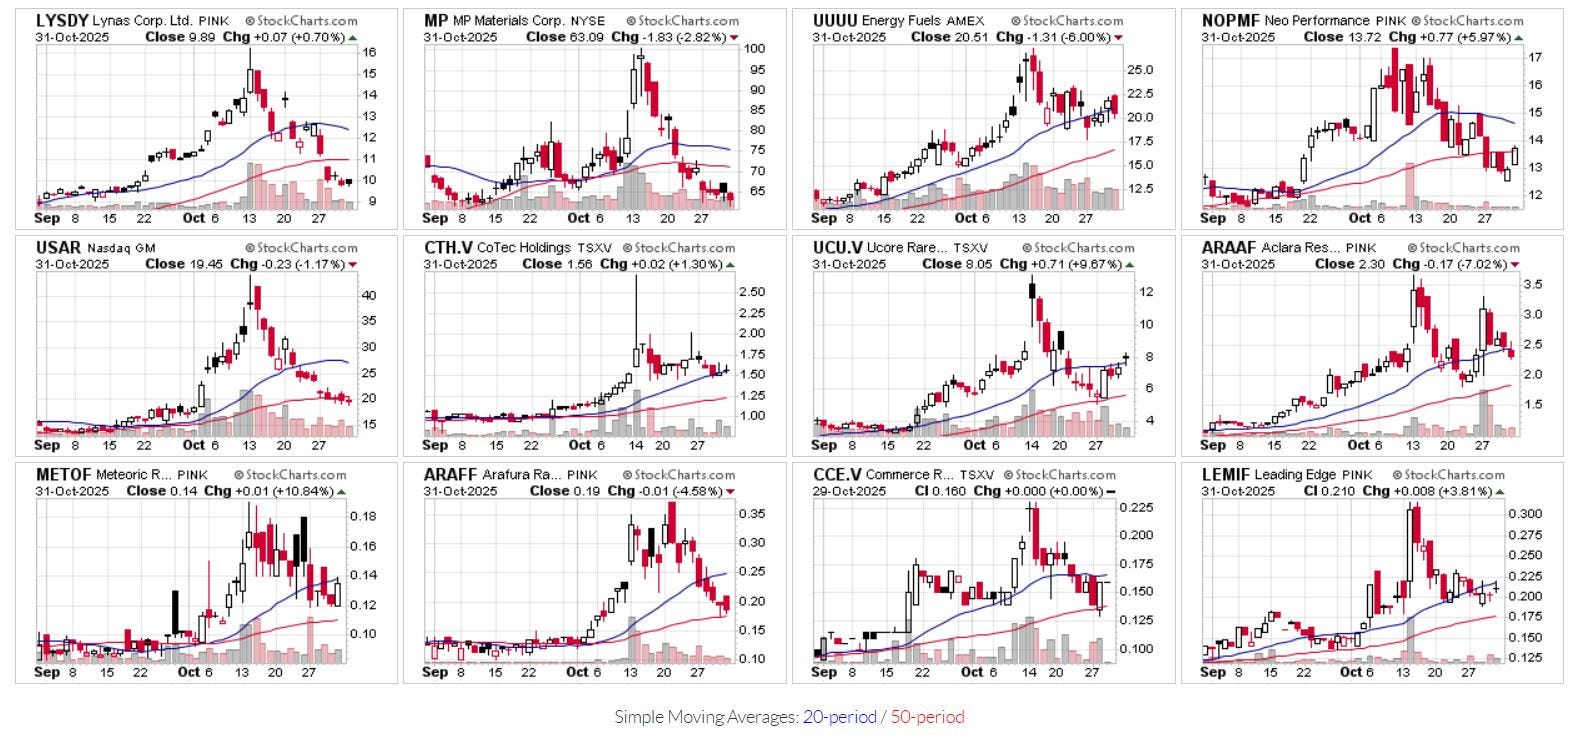
As one can see, it has been pretty ugly pricing action for the REE stocks overall, with most dropping 20%-50% just in the last 2 weeks.
My portfolio has had positions in both Energy Fuels (UUUU) and Neo Performance Materials (NOPMF) as the 2 main REE positions for this year. These trades are still in the green for both stocks, despite their recent weakness.
I’ve taken no action in (NOPMF) and am just riding through the volatility, but did place 2 good trades recently in (UUUU) during the price correction that have been in the money since then.
With the recent rare earth sector selling pressure, I begin accumulating USA Rare Earth, Inc. (Nasdaq: USAR); and already explained the fundamental reasons for this stock in [Part 2 and Part 3] of this series. Obviously, I’ve been cut so far catching the falling knife, but I’ll explain the thought process behind the trading, hoping it is instructive for readers here.
Let’s unpack these 3 charts down below to get a technical pricing update.
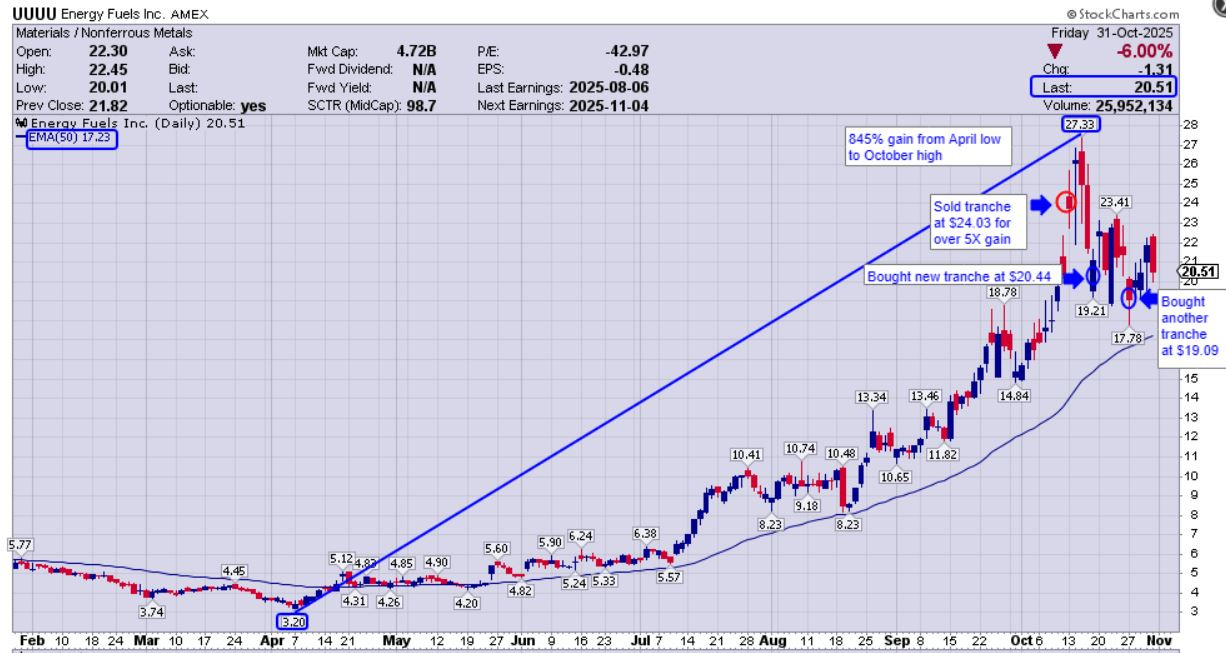
(UUUU) went on an 845% rocket ride off the April low at $3.20 to the October high at $27.33. As we’ve discussed many times, it has the dual-pronged advantage of producing both uranium and rare earths. Additionally the company can produce other critical minerals like vanadium,
I sold a chunk of my (UUUU) position on Oct 13th at $24.03 locking in over a 5X gain, but leaving a core position in place. This decision felt bittersweet the next couple days as shot 3 bucks higher on the 14th and 15th, but then was a relief when things rolled over hard later on the 15th – 17th.
I added a new tranche on Oct 17th at $20.44, and then another tranche on Oct 27th at $19.09, and wrote about those buys in earlier parts of this series. Thus far, those were 2 good adds in Energy Fuels, as the stock climbed up over $22 a few days later.
(UUUU) did correct down really hard by 6% on Friday though, putting in a big bearish engulfing red candle, and closing the week and month at $20.51. That was an ugly looking trading day on Halloween, and we’ll have to see if that killed the upside momentum in the near term.
That price is still well above the 50-day EMA, (currently at $17.23), which keeps it in an overall bullish posture. However, that doesn’t mean it can’t pull back down to test that support level in the days and weeks to come.
The longer-term fundamentals for Energy Fuels are still fantastic, and the business case is there with uranium and rare earths production and its medical isotopes division for it to double or even triple from here over the next 2-3 years.
I’ll be monitoring it for more weakness though, in the near-term. My strategy is to add one more tranche if it tests the 50-day EMA.
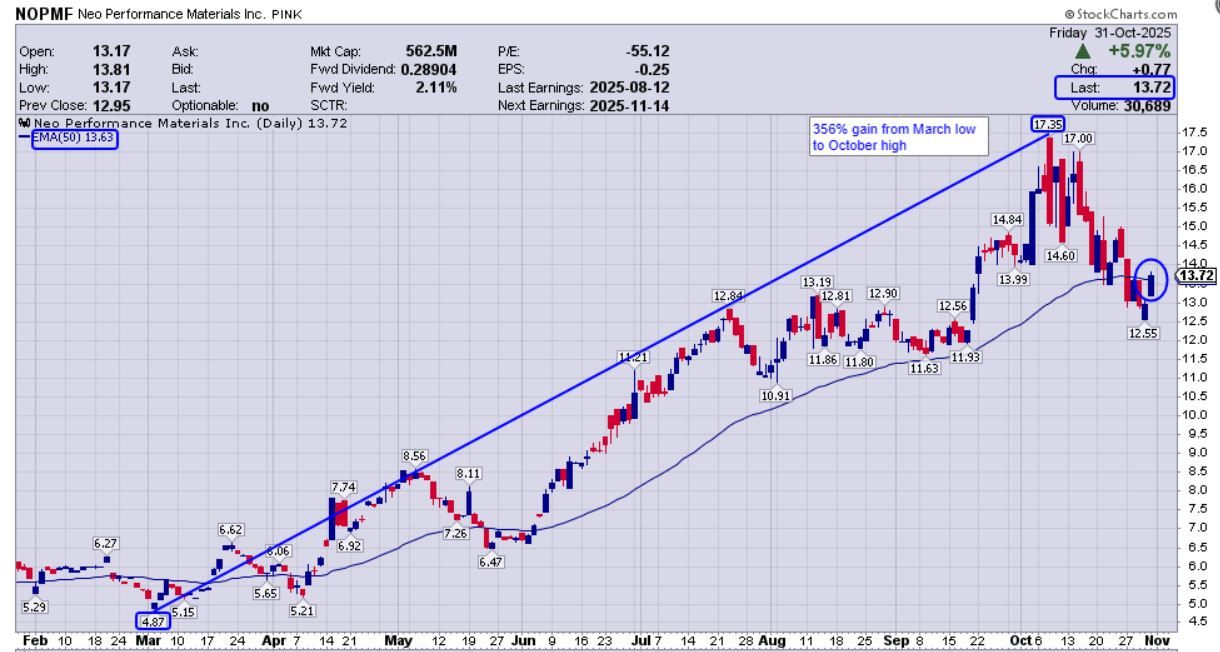
(NOPMF) surged up 356% from the March low at $4.87 up to the recent peak at $17.35. This highlights the strength in the rare earths stocks most of this year, long before the October volatility from the Chinese export controls.
Despite fantastic performance, Neo Performance Materials has actually lagged many other rare earths stocks that were up 6x, 8x, or 10x over the same period of time. This is a bit puzzling, because this is one of the few companies that can refine, process, and separate rare earths, and one of the very few REE stocks with experience producing heave rare earth permanent magnets (where even companies like MP Materials or CoTec Holding haven’t actually done this yet).
I’m not sure why (NOPMF) isn’t already valued at $1billion - $2billion, or why the US government and Department of Defense didn’t also tap them for a strategic investment, like they did with MP Materials. This company has decades of operating experience in both specialty metals and rare earths processing. With so many people proclaiming that we don’t have enough processing domestically, then this company should be front and center on policy makers and investor’s radars.
Back to the technicals… (NOPMF) has mostly trended above the 50-day EMA all year long, and each time pricing has dipped below this level, it has rebounded back up solidly. Granted this recent pricing correction in the second half of October was more pronounced and broke further below that support level than the prior dips.
It was constructive to see pricing in (NOPMF) close the week at $13.72, back slightly up above the 50-day EMA, currently at $13.63. This put the stock mildly back into a bullish posture, but we’ll need to see some more follow through in the week(s) to come for confirmation.
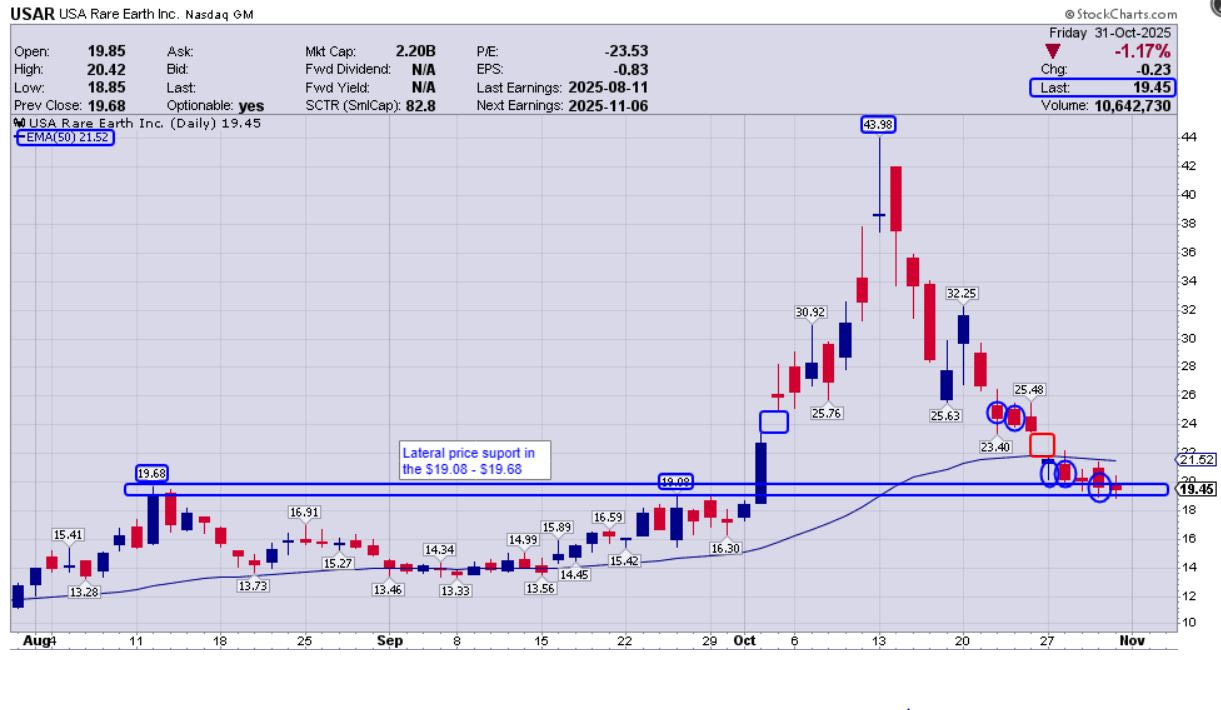
With (USAR) I’ve purchased multiple tranches in various sizes on (10/22) @ $24.44, (10/23) @ $24.18, (10/27) @ $20.70, (10/28) @ $20.08, and (10/30) @ $19.30 {noted with the blue ellipses on the chart above}.
My overall cost basis is now $22.72 and I’m down about 14.4% on this position, as of the close on Friday at $19.45.
I’ve explained in [Part 2] and [Part 3] of this mini-series why I initially bought the ‘gap up’ price fill levels, and then the ‘gap down’ probe to even lower levels, below the 50-day EMA. I stand behind those decisions, and would do the same thing all over again, if that was the technical set up being presented on the charts.
While the pricing did not bounce from those levels in this particular instance, there are many times where those are the precise spots where pricing will find its footing and start trekking higher again. That does not mean that T.A. “doesn’t work” as this is not a crystal ball or fortune telling gimmick. It is simply a tool for stacking the odds and probabilities in one’s favor; and those were favorable places to accumulate a new position.
The additional tranche bought on (10/28) was because pricing had gone up and tested the resistance at the 50-day EMA.
The additional tranche bought on (10/30) was because pricing was down testing lateral pricing support between $19.68 and $19.08, from the prior 2 price peaks back in August and September.
At this point (USAR) remains in a bearish posture, below the 50-day EMA, so it may be foolhardy to have been accumulating below that support. However, I don’t base my trading on only one technical factor or indicator.
As mentioned above, those prior gaps factored into my thinking, as did the lateral price support from prior peaks coming into play at the end of the week.
Pricing is still not in a bullish posture, so I’m prepared to suffer through more potential weakness here, because I also really like the fundamentals of this company (as previously outlined in the prior 2 articles).
Over at the KE Report on Friday, Cory and I were joined by Marc Chandler, Managing Partner at Bannockburn Global Forex and Editor of Marc to Market, for insights on the Fed’s “hawkish cut,” dollar momentum, and the latest U.S.-China trade developments.
Geopolitical Developments and Trade Agreements
The discussion moves to geopolitical trade elements, particularly the recent US-China trade deal, which has implications for markets and risk appetites.
The deal includes aspects such as rare earth materials and port fees, but concerns remain about the US’s long-term independence from China in these sectors.
Chandler emphasizes the need for the US to enhance its processing capabilities for rare earths, which is a significant hurdle in achieving independence from Chinese supply chains. Long-Term Challenges and Strategic Rivalry
Despite the temporary truce between the US and China, Chandler warns that strategic rivalry is likely to persist, with potential for future tensions.
He highlights China’s dominance in various supply chains, particularly in electric vehicle batteries and pharmaceuticals, which poses challenges for the US.
The conversation concludes with a recognition that while current trade agreements may offer short-term relief, the fundamental issues regarding supply chain dependencies remain unresolved.
Let’s move on from rare earth stocks….
Many media pundits are now erroneously lumping most critical minerals that they don’t immediately recognize into the “rare earth elements” bucket, but this is simply poor due diligence and not the case. The export controls on many other critical minerals from China remain unchanged in these latest trade deals.
None of the news specifically targeting the 17 rare earth elements should have had any effect on antimony, or tungsten, or tantalum, or gallium, or indium, or any of the other critical minerals, and yet nonetheless, they still got caught in both the rare earths hype and the corrective cross-fire over the last couple of weeks.
Sure, the theme where China has a stranglehold on their processing and supply to industry is the same, but each element really has its own fundamentals, price, and unique challenges facing the US to find new domestic supplies.
Let’s look at what happened with the price action in United States Antimony Corporation (NYSE American: UAMY) for an example of the most widely followed antimony play.
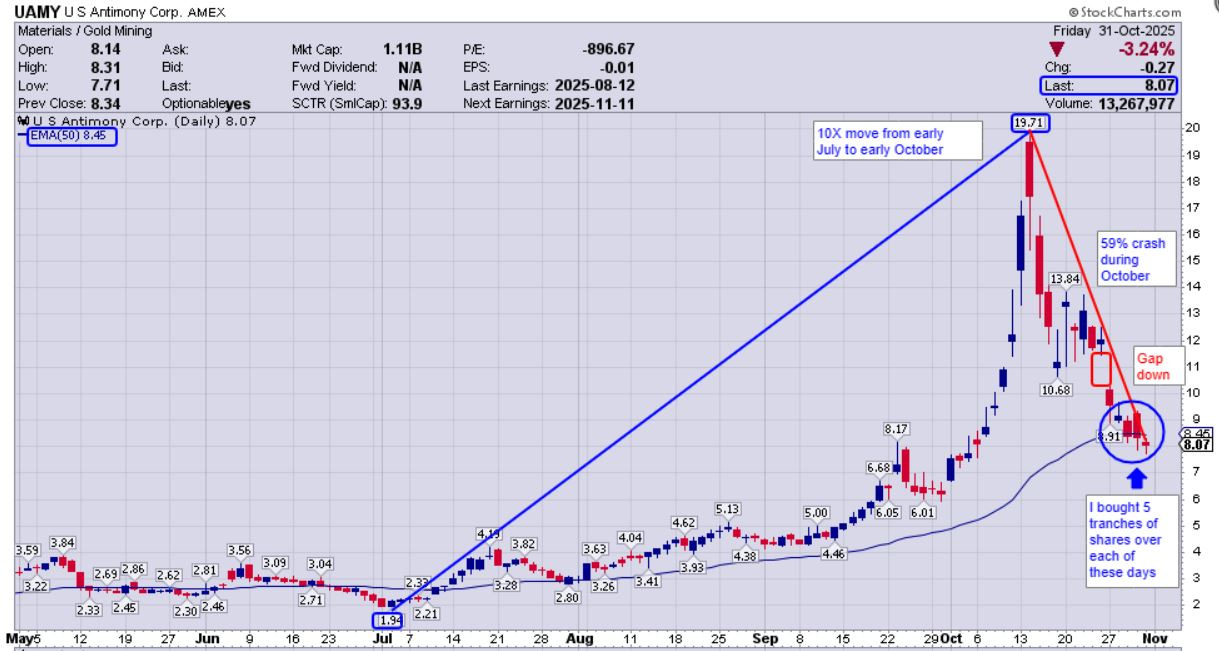
(UAMY) went up over 1,000% (10X or a 10-bagger) from early July to early October this year.
(UAMY) has crashed by 59%, from its October 14th peak at $19.71, down to it’s Friday close to end the week and month at $8.07. This was a parabolic move higher, so it’s not really a surprise to see it tumble down the other side of the parabola, no matter what the fundamental backdrop is.
The recent close at $8.07 was below the 50-day Exponential Moving Average (EMA), [currently at $8.45], keeping the stock in a slightly bearish posture at present.
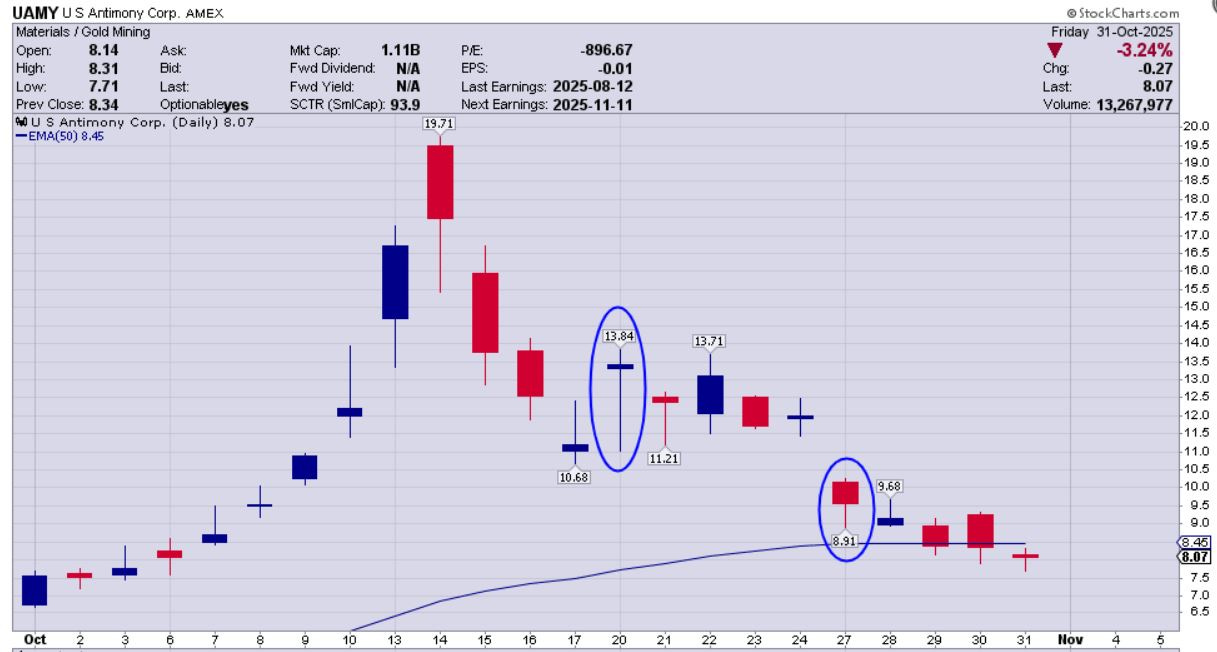
(UAMY) gapped down hard on October 27th, from around $11.45 down to $10.27 and closed around $9.60, which piqued my interest in getting positioned into the market carnage.
I’ve bought 5 different sized tranches of (UAMY) starting on October 27th through Friday Oct 31st at $9.41, $9.11, $8.27, $8.09, and $8.03, for an overall cost basis of $8.93. This position is down 9.6% in the red for me at present, but I believe that gap from October 27th is going to get filled in the fullness of time.
Another consideration I had for all the buying lately was that pricing was on either side of the 50-day EMA, which is often a good accumulation spot. Of course, that does not mean pricing will hold here, and it can still dive down even lower. I’ve got a nice position in place now, watching to see if it does find its footing in the near-term, but am prepared to buy more if continues correcting.
If the stock bounces back up near the $11.00 area (in the middle of that ‘gap down’ zone) then I’ll likely trim 1 or 2 tranches back off as prudent risk management, and then ride the rest of the position for the duration of the journey.
If the stock tumbles down to around $6 lateral price support, then I’ll add another larger tranche to bring the overall cost basis down, and be forced to hold for longer for the stock to recover. Anything is always possible, but it would surprise me to see this stock get meaningfully below $6 in the medium term.
In trading, it is important to have a premeditated strategy for a move in either direction, and apply “if/then” actionable steps for future rallies or corrections.
United States Antimony Corporation (NYSE American: UAMY) and its subsidiaries in the U.S., Mexico, and Canada sell antimony, zeolite, and precious metals primarily in the U.S. and Canada.
The Company processes third party ore into antimony oxide, antimony metal, antimony trisulfide, and precious metals at facilities in Montana and Mexico.
Antimony metal is used in bearings, storage batteries, and ordnance. Antimony trisulfide is used as a primer in ammunition.
Antimony oxide is used to form a flame-retardant system for plastics, rubber, fiberglass, textile goods, paints, coatings, and paper, as a color fastener in paint, and as a phosphorescent agent in fluorescent light bulbs.
The Company also recovers precious metals, primarily gold and silver, at its Montana facility from third party ore.
At its Bear River Zeolite (”BRZ”) facility located in Idaho, the Company mines and processes zeolite, a group of industrial minerals used in water filtration, sewage treatment, nuclear waste and other environmental cleanup, odor control, gas separation, animal nutrition, soil amendment and fertilizer, and other miscellaneous applications.
During 2024 and 2025, the Company began acquiring mining claims and leases located in Montana, Alaska and Ontario, Canada in an effort to expand its operations as well as its product offerings.
Another wildcard factor for this company is that on a couple weeks back it submitted a non-binding indicative proposal to acquire Larvotto Resources Limited, to secure control of one of the world’s largest antimony-gold deposits, the Hillgrove Project in New South Wales, Australia.
United States Antimony Corporation Submits Indicative Proposal to Acquire 100% of Larvotto Resources Limited Located in Australia
- October 19, 2025
https://www.usantimony.com/_files/ugd/3b68bf_f1b2a4017b05468788c3efea7737778f.pdf
There’s a wrinkle with the proposed acquisition now, where Larvotto doesn’t think the offer is enough and shot it down… this news added fuel to the stock’s volatility.
Antimony miner shoots down US takeover bid
Peter Ker - Oct 27, 2025
https://www.afr.com/companies/mining/antimony-miner-shoots-down-us-takeover-bid-20251027-p5n5i3
The acquisition offer news came out on Sunday the 19th, and on Monday Oct 20th this news gave the stock price of UAMY a brief bounce, but the stock had already sold down hard off the high of $19.71 several days before that news ever came out.
The ‘gap down’ on October 27th was likely due to Larvotto saying no to the initial acquisition offer. Again, gaps typically get filled, so the probabilities are that pricing does eventually claw its way back up that $10.50-$11.50 zone in the fullness of time.
We’ll need to see if there is a counter-offer made for a higher value, or if the 2 companies decide to go different directions over the next few weeks. Whatever happens, the resulting news is bound to be a short-duration share price catalyst.
On the positive side, the company just released a healthy operations update across their mining assets in Montana that had a lot of good developments embedded.
United States Antimony Corporation Updates Significant Montana Antimony Mining Activities Company Increases 2026 Financial Guidance
- October 30, 2025
https://www.usantimony.com/_files/ugd/3b68bf_61640102c6c14f28a47f8f3252ea8703.pdf
OK. Let’s move on now to tungsten, as another critical mineral that has been getting a lot of attention lately, and so have the limited number of companies with meaningful tungsten exposure. In [Part 3] we dug into the various uses, fundamental factors pushing this metal higher, and the keen interest from the US government policy initiatives to increase domestic supplies.
My portfolio exposure to this sector is via the company, American Tungsten Corp. (CSE: TUNG) (OTCQB: TUNGF).
In [Part 3] of this mini-series we reviewed fundamental value proposition for this company, project, team, and the upcoming catalysts; along with a recent interview with the CEO of the company.
In that prior article I also unpacked one of my best trades of the year in this stock, picking off a 573% gain (567% after trading fees), getting positioned at $0.3719 and exiting the position at $2.133. However, had I hung on a few more days it could have been a 10-bagger, so it was a bittersweet win in retrospect.
Unfortunately, I’ve gotten bloodied up on my re-entry into this stock during the volatility of the last week, and am down over 12% on the overall position, for one of my worst trades of the year.
I bought the primary initial position in (TUNGF) on (10/27) @ $1.68, and then added a small tranche on (10/30) at $1.40. I should have bought a larger 2nd tranche on 10/30, but have chewed through most of my dry powder the last 2 weeks on Energy Fuels, USA Rare Earth, and United States Antimony, and a few silver and copper names.
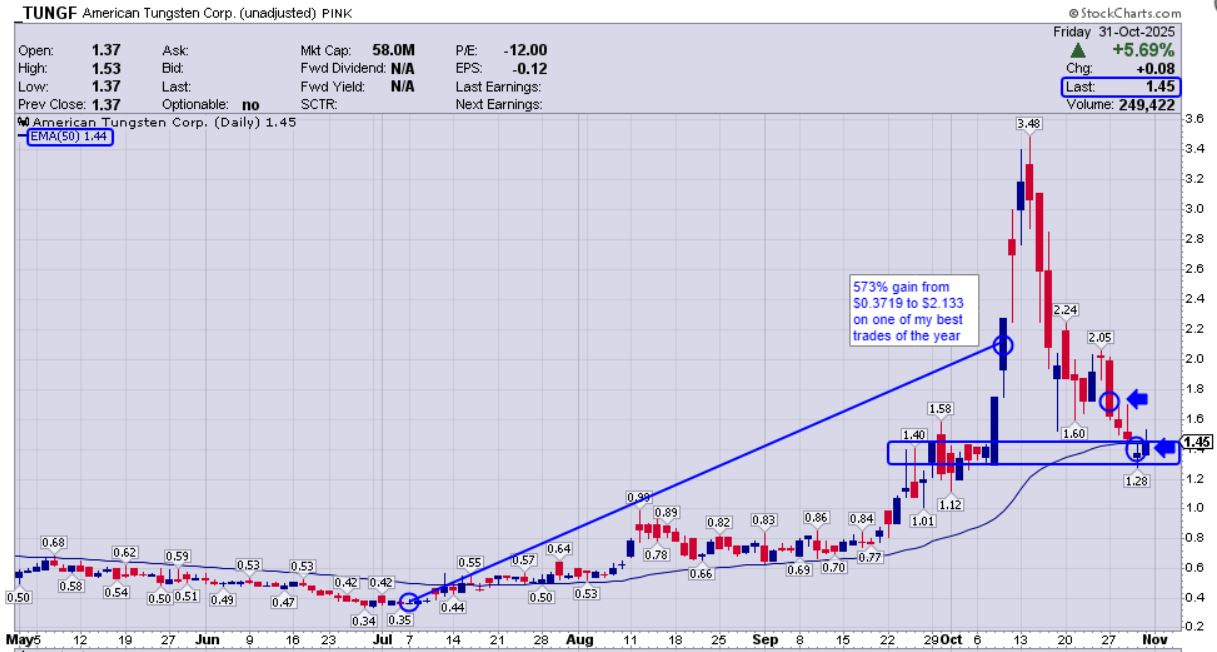
American Tungsten had a waterfall decline down the other side of the parabolic move throughout October, but it does have a few support factors kicking in now; where most of the share price pain may be behind it.
(TUNGF) closed on Friday at $1.45, one penny above the 50-day EMA, (currently at $1.44). If we are being ‘technical’ in this ‘analysis,’ then that move popped it up back into a mildly bullish posture to close up the week.
There is a lot of pricing congestion and lateral price support in the $1.45 to $1.28 zone. This would be an ideal area to muck around for a while, and build a base of support to then launch the next leg higher.
If this support zone fails, then the next lateral price support doesn’t come into play until the high to mid $0.80’s.
I’ll be watching the coming week(s) to see if pricing can stay above the 50-day EMA, and bounce up out of the present danger zone. If that happens, I’ll likely just let the position ride. If support fails, then I’ll have to consider adding one more tranche down around $0.89-$0.84.
Despite my gold, silver, copper, and uranium positions all hanging up there in the green, these critical minerals stocks have definitely been volatile and introduced some red into the portfolio over the last couple weeks. Late October was rough in these stocks, and hoping the month closing up on Halloween ended this carnage.
As an added bonus here is a glossary of Spooky Market Halloween Terms:
https://daytradespy.com/42138/spooky-market-halloween-terms/
Thanks for reading and may you have prosperity in your trading and in life!
Shad