Commodities Update - Week In Review And The Week Ahead – Part 14A Precious Metals
Excelsior Prosperity w/ Shad Marquitz - (08/03/2024)
It’s been a while since we’ve done a good old-fashioned commodity sector review. We’ve had enough price movement in many commodities, since the last update, to make this more pertinent now to see the way things are trending. In this first [Part 14A] we are going to spend some time just dissecting the precious metals sector. Then in the next part B we’ll get into more of the energy commodities like oil, natural gas, uranium, and copper.
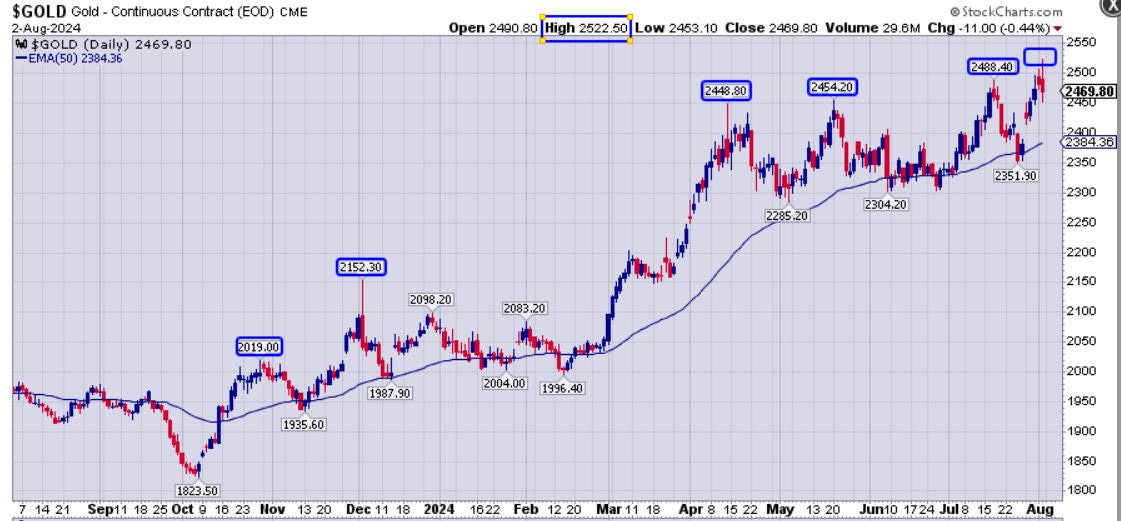
Let’s kick things off with a 1-year daily chart of Gold, which has been a thing of beauty.
Let’s keep this really simple, and not get into a myriad of chart overlays and indicators and simply look at price making a series of higher lows, and more importantly, higher highs: Note the pricing peaks in the blue rectangles from $2,019, to $2,152.30, to $2,448.80, to $2,454.20, to $2,488.40, and to the recent high this last week of $2,522.50. That is some stellar action in the yellow metal!
The other thing to note is that it has generally respected and responded to the 50-day Exponential Moving Average (EMA). It was resistance last fall, and then starting in November of 2023, it shifted to support, and retested it in December, January, February, got close in May, rode along it as support in June, and then retested it last month in July. Until something changes, I’d anticipate gold to continue finding it’s footing at the 50-day EMA, and if that breaks decisively then we’ll look to the 144-day and 200-day EMAs or the weekly EMAs for more guidance.
Shifting over to the gold stocks isn’t as pretty of a picture, but the gold equities have been in an overall bullish posture.
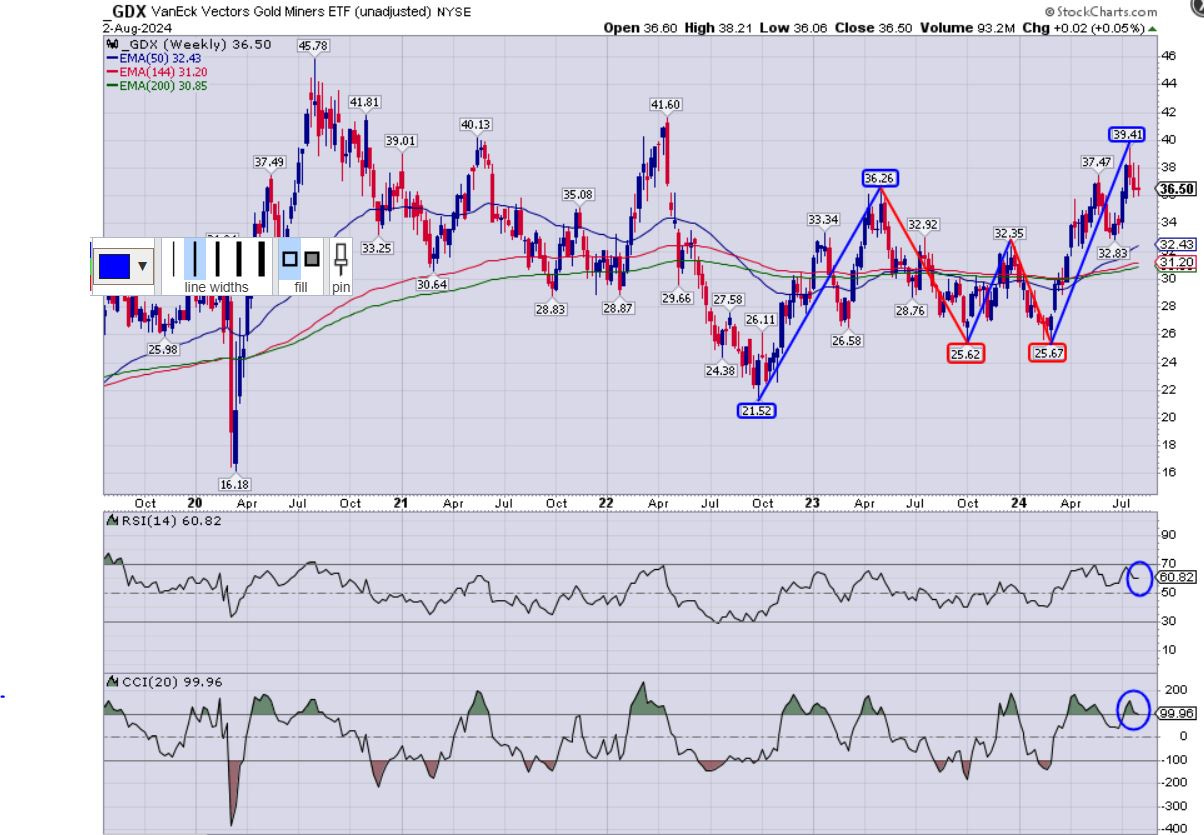
Let’s have a look at the VanEck Gold Miners ETF (GDX):
(GDX) put in an intermediate-term bottom back in late September of 2022 at $21.52, and then had a nice 7 month rally up to $36.26 in May of 2023. It corrected down into the fall of 2023 in early October to $25.62, then had a Santa Claus rally up to $32.35 in December, and then pulled back down to retest support and double-bottom at $25.67 in late February of this year. It has run much higher off that W-shaped double-bottom putting in a higher peak last week at $39.41, for a new 52-week high.
However, many investors and sector pundits are a bit disappointed, that with gold continuing to make new all-time highs, that GDX still hasn’t even taken out it’s 2022 peak at $41.60, or the 2020 peak at $45.78. Even though margins are expanding in these higher gold prices, the gold stock prices are not expanding with the torque many would expect to see.
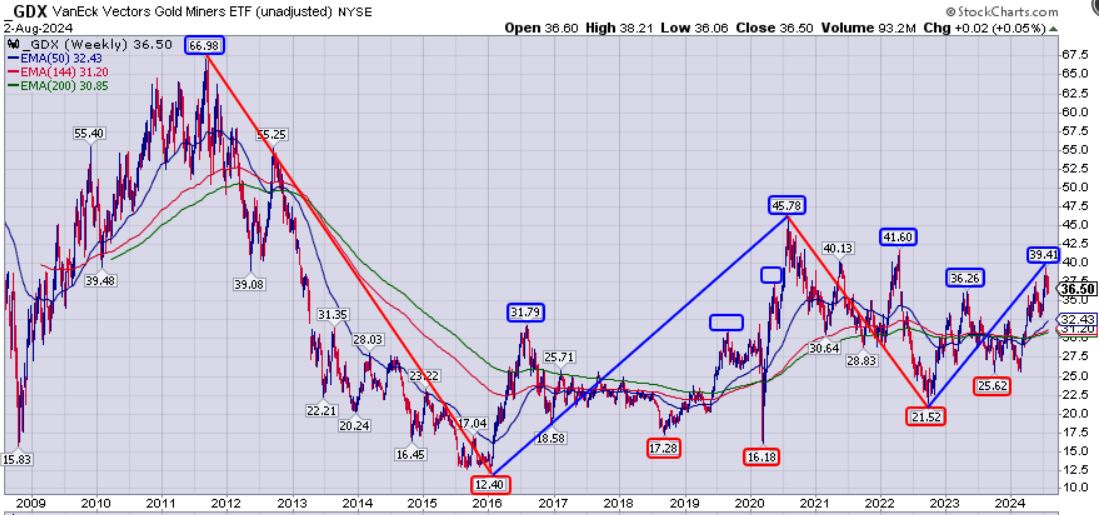
In fact, if we scan back in time, GDX is still a long ways off from it’s prior all-time high of $66.98 from back in 2011 at the Major Top of the prior cycle. With where GDX closed the week on Friday at $36.50, it almost has to double just to make it up to new all-time highs, so this disconnect between the gold equities and gold is driving investors bananas.
The gold margins back in 2011 were around $640, and they are the same or actually better than that today with average costs around $1500-$1600 for producers and the gold price averaging around $2200-$2400 for months now for a $600-$900 margin for the majority of gold producers. So the “margin contraction” excuse is simply not there and comes nowhere close to explaining away why GDX isn’t above $66.98 or above $70 for that matter. Maybe it is all due to dilution, as some have noted, but most of the producers grew their resources, added in more mines to their portfolios, and many of them took over other development or producing companies to actually become much larger companies with that dilution, so even that boogeyman really doesn’t explain away the divergence.
We can say that in general, the PM stocks have been in a larger uptrend since their Major Low back in January of 2016. However, some people would say the uptrend was so messy with fits and starts, that it didn’t “feel” like a bull market, and the windows of time to make money in the sector were brief from 6 months to a year at a time.
There was the 8-month 2016 surge of the “Baby Bull” from January to August, followed by a 2-year consolidation until October of 2018, and then a trend higher for almost 14 months into early 2020, that got interrupted by a global pandemic crash in March of 2020. With that exception aside, the gold miners were making higher highs and higher lows.
However after another blistering 5-month rally from mid-March to mid-August 2020 up to $45.78, GDX then went into an incredibly choppy 2-year period of whip-saw pricing action for the latter part of 2020 through the later part of 2022. There were pops, then drops, then more pops, then more drops in the gold producers and mid-tiers, but there were lower lows and while there were tradable rallies the overall trend was lower. Simultaneously the gold junior developers and explorers were largely in a full-on bear market, with many of the juniors crashing 60%-90% over that period of time; and the majority did not experience the rallies that the producers got.
Since GDX put in it’s intermediate low in late September of 2022 at $21.52, it has been in a general uptrend through present up to the recent peak at $39.41. Yes, it has been messy whipsaw price action, but the first clue was the 8-month rally from late September 2022 through the regional banking crisis high of $36.26 in May of 2023. Then pricing consolidated in a sideways to down range for a long time, making a higher low at $25.62 in the fall of 2023, then then surging higher again into the Santa Claus rally and early part of the Q1 run, but then dipping down into late February, and the blasting higher through August of this year.
The point is that investors didn’t have to “nail the low” to have had PLENTY of opportunities to scale into a good cost basis in the gold producers for many years now. GDX spent a great deal of time in the low to mid-$20s before a series of rallies into the mid to high $30s, and even low $40’s the last few years. That is huge spread in pricing action that could have been exploited by both shorter-duration position traders, and even longer-term value investors. We keep hearing rubbish like “nobody could have made any money in this sector,” or “this sector has been dead for years.”
The reality though, is that there has been a huge amount of volatility where there were actually a series of a half-dozen multi-month (5, 6, 8, and even a 14-month) rallies, where many of the quality gold producers [especially in the mid-tiers and smaller growth oriented producers] went up double-digits or single-digits on each rally. So opportunities were there for the more active traders following the charts, or for longer-term value investors to accumulate. It just wasn’t the multi-year rising tide lifting all boats that we like to see, that bails out even the worst traders and investors in any sector when everything keeps ripping higher.
Again, gold miners have fared better than junior pre-revenue companies, for the last few years. However, any thinking person, or investor that has been trading resource stocks for any length of time, will realize that is totally to be expected, since they actually have resources, revenues, and can monetize the higher gold prices.
We always see the gold producers rally first out of major sentiment and pricing turns, and this is why one should not be shrugging off being positioned in the producers at turns into new impulse legs higher. (really in any commodity — be it gold, silver, copper, base metals, uranium, oil, or nat gas - those same investor patterns emerge.) A strategy that has worked for me in resource stocks is being in the producers or large ETFs first, at turns, and then branching out into the developers and explorers as the momentum picks up.
Yes, EVENTUALLY the junior developers and explorers in any commodity will get a bid and then start to outperform. Having said that — being “all-in” on pre-revenue juniors during and even after downwards consolidation periods, when there is not a raging bull market is a poor strategy.
Many investors have been positioned solely in junior pre-revenue developers and explorers WAY TOO EARLY for most of the initial rally periods in the building bull market, and this likely explains their poor sentiment, stemming from their own portfolio underperformance. Now, some of the juniors did eventually move a few months into the rallies, but the action was anticipated to be in the producers and best-in-class juniors when the worm turned….and it was.
It really makes more sense to be most heavily-weighted to the producers and royalty companies until solid uptrends are established and the sector momentum starts to build (usually 1-2 months after a turn commences). If more investors would have adopted this approach, then they’d have had some double-digit or triple-digit gains, that they could have harvested and then bought the explorers and developers at the low valuations they dove down to. (I can’t issue investment advice, so that isn’t what this is, but just sharing my personal strategy and opinions that have benefited me coming out of bottoming phases and sector turns in multiple commodities for many many years now).
There is a school of thought, from many precious metals investors and sector thought leaders, that a big problem with this cycle, and why the juniors haven’t seen inflows and bigger volumes is that Silver has not been looking as bullish as Gold; and thus the speculative animal spirits have just not been flooding into the PM stocks. That is the narrative, but let’s look at the price action on the charts to see how silver has been performing over these last few years.
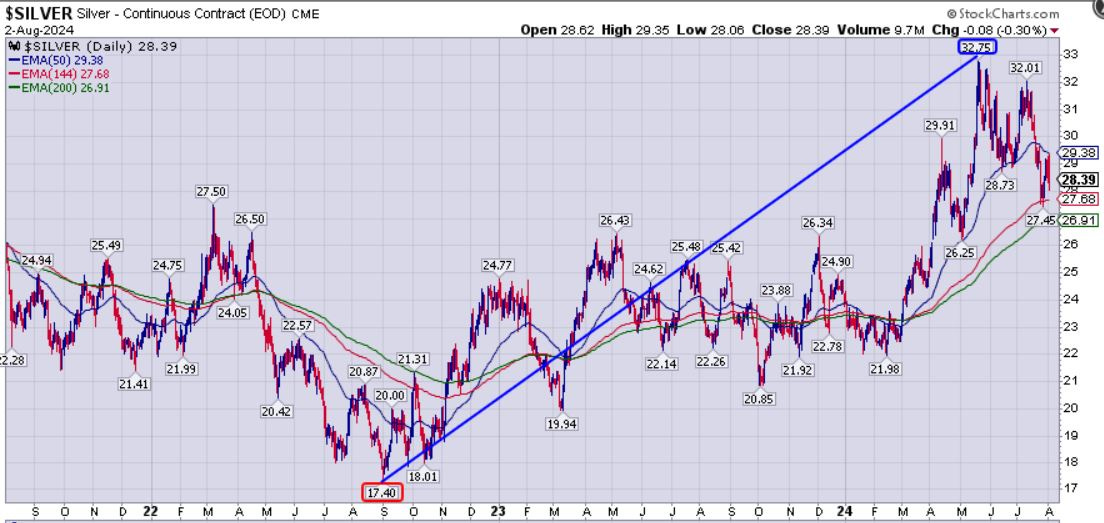
Just like we saw GDX bottom in late September 2022, we actually saw silver bottom about 2 weeks before that in early September of 2022 at $17.40. Since then Silver has been steady climbing higher in fits and starts and nearly doubled in price from $17.40 to the May 2024 peak at $32.75 (up over 88% in a year and half).
Is that not outperformance in Silver versus Gold since that intermediate low? (clearly it has been silver outperformance, because gold was only up 55.8% from it's triple bottom low of $1618.30 in the fall of 2022 up through the recent all-time high of $2522.50).
So the reality (when we look at data, numbers, and charts versus falling for emotional negative Nancy narratives) is that Silver actually has fared better than Gold on a performance basis since the intermediate low in the PM sector in the fall 2022. I don’t think most investors realize that.
This outperformance in silver may explain why some mid-tier silver producers have outperformed a number of the gold producers over that time. So from that standpoint, investors stacking silver in the fall of 2022 when we saw the intermediate bottom, or even for most of 2023, have been richly rewarded in appreciation of the metal. There was plenty of opportunity.
The difference though is that Silver is nowhere near it’s all-time high of $49-$50, and Gold has been continually blasting up to new all-time highs since November of 2023. Additionally, many silver investors want to see 2:1 or even 3:1 outperformance over gold for there to be real momentum in the PM stocks.
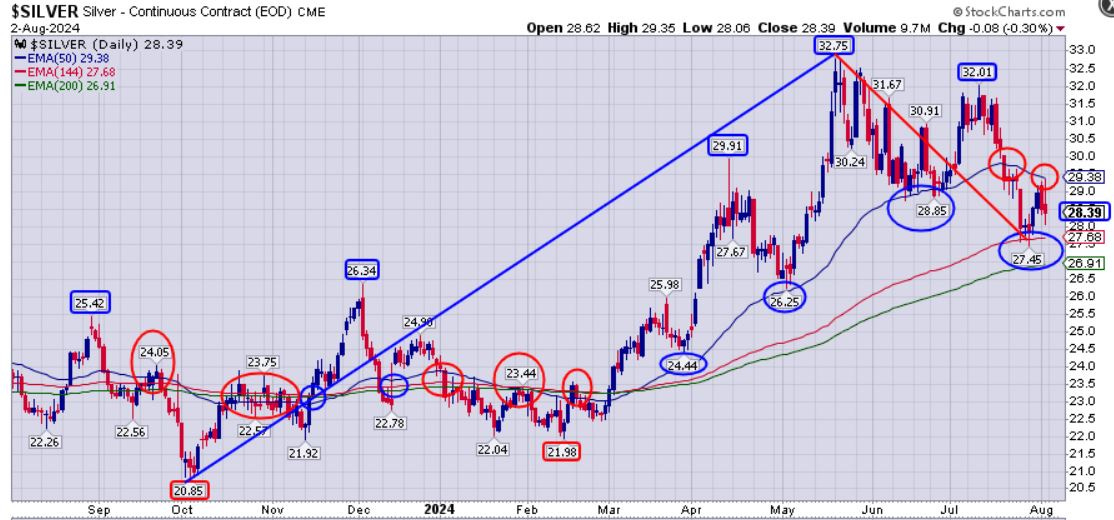
Let’s have a look at the 1-year daily chart of silver to see how its been going over a more narrow window of time:
Once again, in the Fall of 2023 we saw silver correct back down below the key moving averages to $20.85 in early October. It had a snapback rally back over the key moving averages up to $26.34, and then consolidated down into mid-February at $21.98, before turning it around and moving higher.
Silver really hit the turbo jets when gold took off starting on March 1st of this year from around the $23 level and shooting up to near $33 in May ($32.75 actual peak). Since then Silver has been in an overall downtrend consolidating that move, and then we saw price action break decisively below the 50-day EMA in July. However, it did find support at the 144-day EMA and bounce back up from there, but has been getting capped at the 50-day EMA, which has moved from support to resistance.
Silver bulls will want to see a number of price closes back above the 50-day EMA to move it back into a more bullish posture, and will want to see it avoid breaking below the 144-day EMA and moving towards the 200-day EMA.
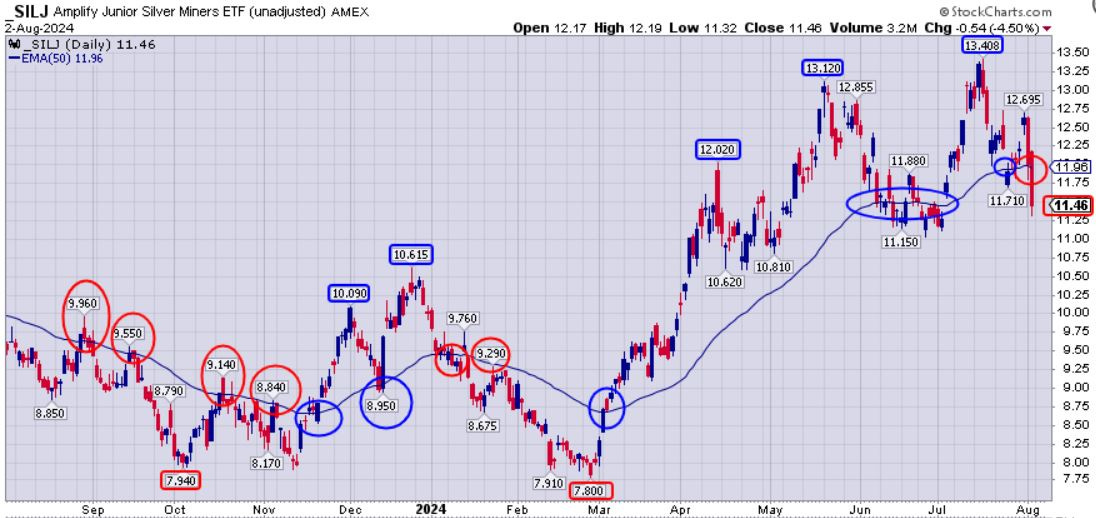
Now let’s look at the silver mining stocks. While I realize (SIL) is a better comparable to the senior producers in (GDX), I personally don’t like that ETF and think it has way too many gold stocks included that warp it’s reflection of what is happening in the silver stocks. As a result, (SILJ) is the superior proxy for looking at the silver equities performance, and even though it is called a “junior” ETF, most of the companies included are still senior and mid-tier producers, and smaller producers, with only a tiny weighting to a few of the true junior stocks.
With (SILJ) one can easily see that it tends to respect and react based around the 50-day EMA, like many charts we’ve looked at in the PM sector. The 50-day EMA was clear overhead resistance in Sep/Oct/Nov of last year, then shifted to support in later Nov/Dec, then shifted back to resistance in Jan 2024, and marked a breakout level in to kick off March of this year. SILJ pricing hovered on either side of the 50-day EMA all through June, lifted back off that level for another rally in July, and then just sliced through that level, as failed support, here in early August.
Still that roughly 72% rally from the $7.80 low in February of this year to recent peak of $13.41 in July, raised a lot of eyebrows in the sector, and was a very encouraging move in the silver equities where investors that had been accumulating the weakness in the 2nd half of 2023 first quarter of 2024 were richly rewarded for “buying low.”
Of course, investors (me included) would have liked to have seen more action, based on all the moves higher in gold, silver, and the gold stocks over that same period, but still, it was a very solid rally. Now with the end-of-the-week crash in (SILJ) down to $11.46 on Friday, well below the 50-day EMA, then this coming week’s trading action will be very important; to see if it can have a snapback rally and get back decisively above that 50-day EMA level and hold it, or if the selling pressure will extend further into a more bearish trend unfolding.
A few key takeaways from all this analysis:
The precious metals complex (Gold, Silver, GDX, SILJ) has been in a general uptrend since the Fall of 2022. While it has been sloppy whipsaw pricing in the mining stocks and silver, in comparison to gold’s steady advance, the whole sector has advanced higher for the last year and half.
You wouldn’t know that based on the sour sentiment that still exists in the sector, because many investors are piled into junior stocks that have not fared nearly as well as the rest of the sector, and either popped and then dropped, or didn’t even get moving. It is an error in judgement for investors to get sucked down into the muck, crying in their beer over their juniors not moving, because those individuals are clearly missing the trend we’ve seen higher in the metals and quality stocks.
Gold has fared well getting a safe haven bid (and central bank bid), shielding investors from financial and geopolitical risk. Additionally though, silver, and the PM equities have actually done quite well also and actually outperformed the yellow metal in percentage terms (and central banks aren’t buying silver or PM stocks). Simply put, there has been other buying in the precious metals complex beyond just central bank buying. That sole explanation for gold’s strength dissolves under just 1 minute of analysis.
Having said that, the normal 2:1 or 3:1 torque that investors like to see in silver and the PM stocks has been limited to some of the higher torque growth-oriented producers and best-in-class developers and advanced explorers. [That is precisely why we’ll continue to review those types of companies in various series on this channel, as they’ve been the clear winners this cycle, and likely will continue to do well as this bull market further unfolds].
With the investing universe obsessed over the Fed rate-cutting cycle anticipated to kick off at the September FOMC meeting, then we should see interest rates continue to remain muted to down in sympathy (like they have been recently), and this should bode well for at least gold. As for the concerns that the economic data is weakening, and that we finally may be heading towards a recession, that will remain a headwind to silver and the PM stocks (but not a headwind that totally prevents them flying higher as things unfold - they’ll just have more work to do is all). It will be a bit of a tug-of-war on the macroeconomic stage, but if gold continues to keep plowing higher, then it should underpin support for silver and PM stocks, and could even drag them higher even if general US equities remain under pressure.
I’ve mostly just been holding steady for the vast majority of my PM portfolio positions recently, and just doing a little rebalancing in the interim in partial positions; trimming back a few silver names that had really run higher recently, and refortifying some royalty and gold positions that I had trimmed back previously.
That’s all for this review of the precious metals sector, and stay tuned for the next update soon on the energy commodities.
Thanks for reading and may you have prosperity in your trading and in life!
- Shad

