Commodities Update - Week In Review And The Week Ahead – Part 15
Excelsior Prosperity w/ Shad Marquitz - (08/17/2024)
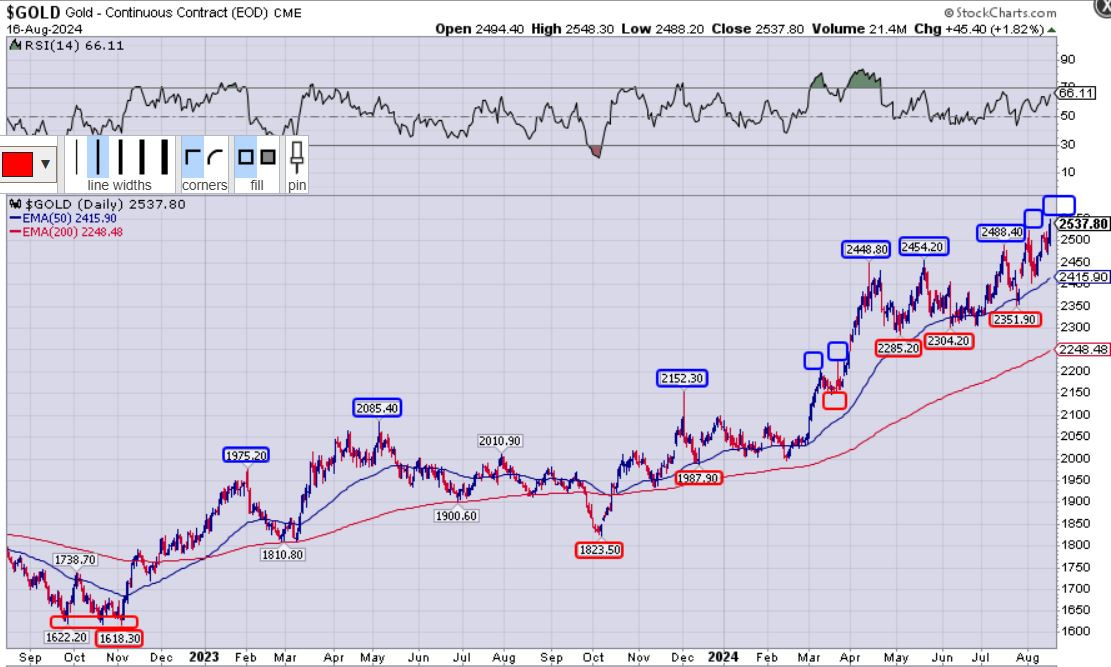
Let’s kick things off with a 2-year daily chart of Gold:
Since the bear-trap triple-bottom lows at $1,622-$1,621-$1,618 back in September-October-November of 2022, the gold chart has been in a solid uptrend and has been a thing of beauty. We’ve seen a steady string of higher lows, and more importantly a string of higher highs Gold just closed this last we.ek at yet another all-time high close of $2,537.80. We’ve seen pricing respect both the 50-day and 200-day Exponential Moving Averages (EMAs) as levels of support. The gold price is still not overbought on the RSI with a reading of 66.11 on Friday. What else can one say about gold technically? It has been solid bullish action, and it has been the most constructive looking chart of all the commodities over the last 2 years.
Just as an aside: Remember when people used to dream of $2,000 gold or of it breaking decisively above $2,100? Remember when the prospect of gold closing above $2,500 would have been reason to put on the party hats and break out the bubbly? Remember that? What happened to the interest in this space?
Gold quietly closed above $2,500 a few times recently, and did it again yesterday to end the week at an all-time high close, and yet there has hardly been a mention of gold in the mainstream financial media and no dancing in the streets from PM investors. It’s just an odd price versus sentiment environment…
For many precious metals investors, the juxtaposition of the surging gold prices to a string of new highs, when counter-balanced against the inability of the gold stocks to get anywhere close to their all-time highs, has been a bittersweet and mixed experience.
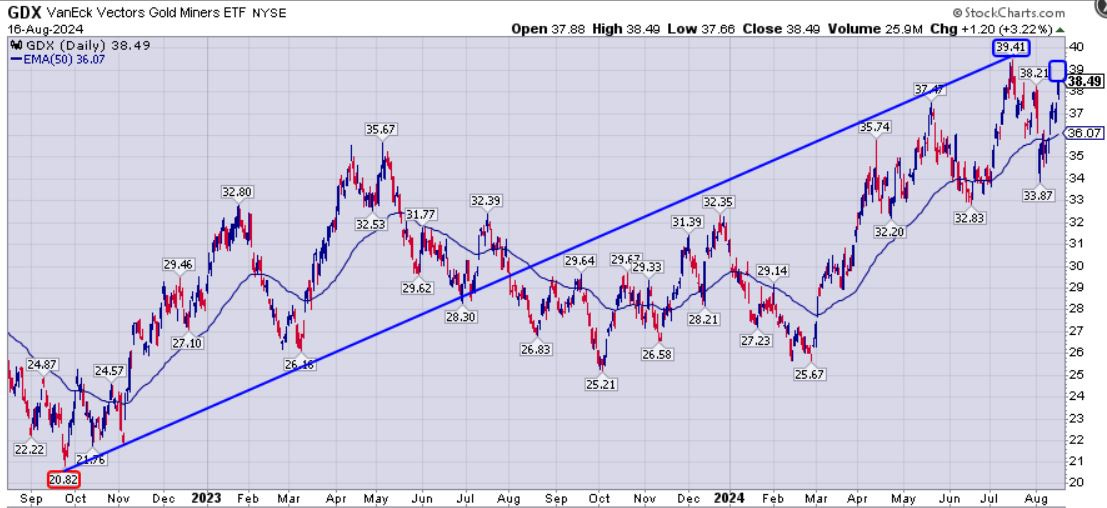
Over that same 2-year period since the PM complex bottomed in the Fall of 2022, the VanEck Gold Miners ETF (GDX) has moved up over 89% from the low at $20.82 in late September 2022, up to the recent peak at $39.41 in July 2024.
So, it clearly did outperform the move in gold which only went up just under 57% over that same period from it low at $1618 to the close yesterday at $2537.
Most investors have just expected a bit more outperformance from the gold stocks at least a 2:1 ratio or in solid bull legs a 3:1 ratio. That would have had GDX up 114% to 171% over that same period, and not just the 89% it actually achieved. Case in point: (GDX) closed this week at $38.49 (lower than even that recent high in July at $39.41) despite gold putting in a new all-time high on the daily/weekly charts. What gives?
Maybe that doesn’t seem like a big disconnect, but when scanning back and looking at where GDX has been in the past, this close yesterday isn’t even above the prior peaks at $41.60 in early 2022, or $45.78 in the summer of 2020, when gold was as much lower prices. As we’ve addressed in prior articles, the margins were lower then than they are now, even after factoring in inflation the last few years. More shocking is that the GDX is nowhere even close to the prior peaks at $45.10 and $55.40 in 2009, or the $66.98 Major High during the peak of the gold move in 2011 in the prior cycle when it got up to $1921. Again, gold producers didn’t have margins then anywhere close to as high as where they are today.
The margins today are far higher than they were back then, so the “margin compression” “rising costs” boogeyman, does not even work mathematically and is clearly not the reason for this disconnect. Back in 2010 the average margin for gold producers was around $480, and in 2011 it was $640. At the peak of 2020, the best margins we’d ever seen were at $800. Today, if you figure the average cost is $1400-$1600 (we’ll split the difference at $1500), and the gold price has been at $2400-$2500, then the margins are $900-$1000 right now, and actually the highest we’ve ever seen. There are actually some royalty companies that currently have $2,000 margins right now.
So, again, the “rising costs have eaten into their margins” excuse is simply not valid. That line of thinking parroted around the sector hasn’t held water for a long time for any thinking person, as we’ve consistently had margins similar or higher than those 2009-2011 levels for the last few years. We are currently at peak margins (the highest we’ve ever seen, and yes, even higher than in 2020)… so why isn’t the forward-looking market pricing in a GDX price well above the old $66.98 peak from 2011 and well into the $70s or $80s? Heck, for that matter, why wasn’t the GDX peak in 2020 higher than the period of time from 2009-2011 as at that time those were the highest margins on record. The issue isn’t margins.
Another point: It’s not just the dilution boogeyman either. As we’ve discussed many times; most of the producers have acquired other companies, added in more mines, and developed far larger resources now with that dilution they experienced. These companies in the GDX are much larger, with more mines, and far more mineral resources now than in the prior cycle. That is not nearly the same thing as tiny junior drill plays that diluted away their share-count raising money to poke holes in the ground, that didn’t acquire other companies, build more mines, or drill out substantially larger resources.
It's the sour sector sentiment and the lack of momentum. Period. There are no metrics to explain away the divergence in where the GDX price is today versus where it was at the peak of the last cycle, or even a few years ago. We’ve seen the other extreme of this effect when we’ve seen prior crypto valuations or the recent rally in tech stocks scorch up to valuations that no longer made mathematical sense, and it was because of euphoric sentiment and major momentum. So, the real question is when (if ever) will the sentiment and momentum return to the gold mining stocks?
As we discussed in our last commodities update, it may be that Silver has not had the big leverage that many commodities investors would have assumed, to coincide with these higher gold prices. That may be affecting investors perceptions and sentiment, so let’s look again at the Silver chart.
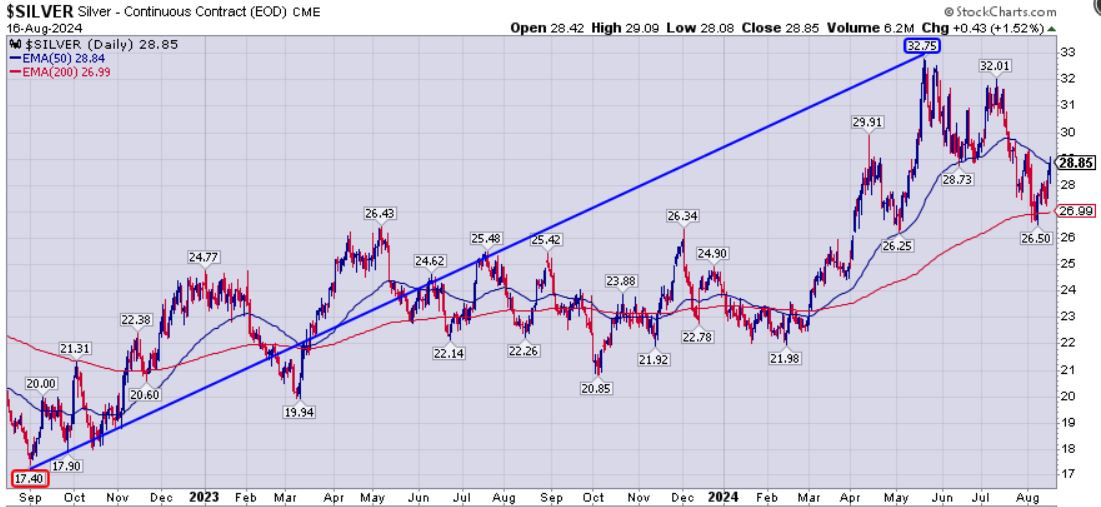
Since that PM complex intermediate low in the Autumn of 2022, where Silver got down to $17.40, it then moved up 88% to it’s recent peak in May of 2024 at $32.75. So the 88% move in silver, was similar to the 89% move in GDX over the last 2 years. Yes, they both outperformed the move in gold, but just not by a factor of 2:1 or 3:1 that investors want to see.
Maybe that helps explain why we still see the continued sour sector sentiment.
Silver has been pulling back since making that peak a few months back, in harmony with most of the other industrial metals like copper, nickel, and aluminum also rolling over the last couple of months on recession concerns. Silver was using the 50-day EMA for support in May and June this year, but then broke down through it in July. It did find new support at the 200-day EMA; bouncing of that level back up to the 50-day EMA once again. Silver bulls will want to see pricing get back above that 50-day EMA for a period of time and push up higher from it, using the 50-day EMA as support once again. Bulls won’t want to see pricing get capped at this level instead, and then head back down to the 200-day EMA again.
Craig Hemke, Editor of TF Metals Report joined us over at the KE Report earlier last week to discuss the recent surge in gold prices, which have surpassed the $2,500 mark. We analyzed the shallow dips in gold prices through July and August, explored the geopolitical influences, and examined historical trading ranges. We also touched on silver's performance, the gold-silver ratio, and the recent high premium M&A activity in the precious metals sector, notably Gold Field’s acquisition of Osisko Mining for US$1.6billion. We then delve into hedge fund positions and the potential impacts of upcoming economic data on gold and silver prices.
Craig Hemke - Gold All-Time Highs Over $2,500, Gold:Silver Ratio To 90, Osisko Mining M&A - Aug 13, 2024
As Craig mentioned, Silver as a hybrid industrial metal / precious metal, sits in the middle of both copper and gold, and is tugged in both directions.
Let’s also look into Copper price, to see what the good doctor is signaling as far as the health outlook for the economy.
Copper has generally been in an uptrend the last couple years, but has been more volatile, and clearly rolled over much harder than silver has since making an all-time high at $5.199 in May. Thus far, Copper has put in a higher-low recently at $3.921 compared to the 2 prior lows at $3.52 in October 2023, and $3.243 in September of 2022. Pricing did close up mildly this last week to close Friday at $4.14, but it is still under the 50-day and 200-day EMAs. Bulls will want to see copper pricing reclaim levels above those EMAs, and retest and exceed the recent lessor peak at $4.70. This is going to be a process that takes some time, and it will likely be a while until we see copper pricing go up and challenge the all-time highs around $5.20 again.
Next, let’s take a look at copper producers in the Global X Copper Miners (COPX):
Much like copper, (COPX) has generally been in an uptrend the last couple years, but been more volatile, and clearly has rolled over hard since making an all-time high at $52.72 in May. Thus far, COPX has put in a higher-low recently at $38.17 compared to the 2 prior lows at $31.22 in November 2023, and $25.69 in September of 2022. Pricing did close up mildly this last week to close Friday at $42.30, which did get it closing up above the 200-day EMA (currently at $41.69). The next level to test to get more bullish would be decisively above the 50-day EMA (currently at $43.31). Bulls will want not want to see COPX fall back below the 200-day EMA.
Matt Badiali, Editor of The New Energy Investor published under Mangrove Investor, joined us over at the KE Report to share his thoughts on the copper price pullback and what fundamental data around supply and demand to actually trust.
Matt Badiali – Copper Pullback; Buy The Dip Or New Bear Market? - Aug 14, 2024
The conversation with Matt explores whether this decline presents a buying opportunity or signals the end of the copper market run since 2016. Topics include supply and demand dynamics, the potential for further M&A post the US$1.6billion Filo takeover by Lundin Mining and BHP, government’s policy effects on the commodities markets, and investment strategies in copper, such as buying individual stocks vs ETFs. Matt shares his insights on the cyclical nature of commodities and his approach to long-term investment in senior copper producers. He emphasizes the importance of understanding macroeconomic trends and anecdotal evidence when making investment decisions.
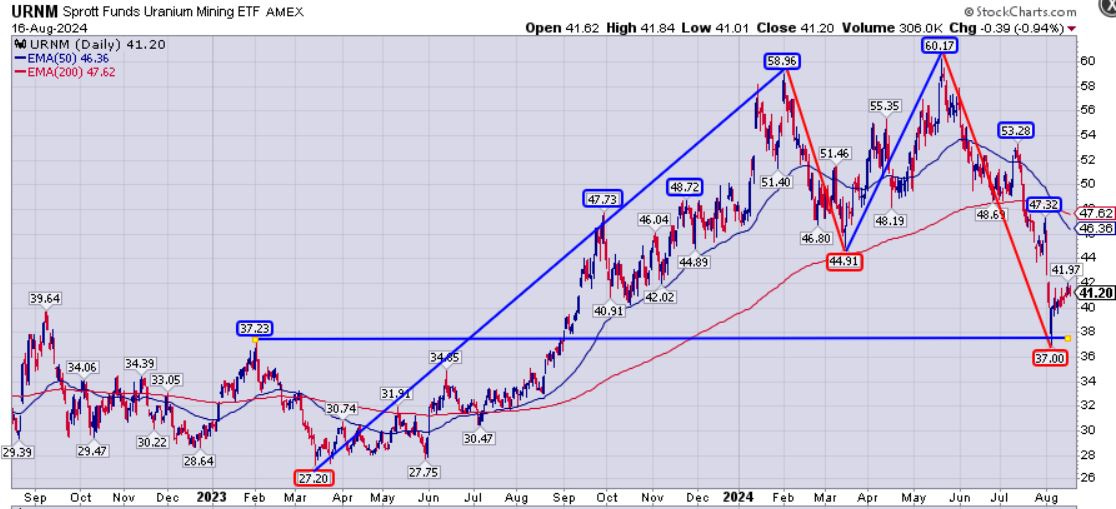
Next let’s have a look at how the U-Stocks are doing in the Sprott Funds Uranium Mining ETF (URNM):
Well, the potential cup and handle pattern, that many technicians were watching, from the peaks in early February and May, ended up having a handle that went on too long and went down to far (making it a failed pattern) until it started a cascading fall to the downside the last few months. Panning back we can now see that those 2 highs at $58.96 and $60.17 ended up making more of a double-top M-shaped pattern. We did see the URNM price slice down through both the 50-day and 200-day EMAs, which was a bearish signal, and it finally found support around the lateral price support from the prior early 2023 peak at $37.23 (with pricing dipping briefly below there down to $37.00 before bouncing back up into the low $40s).
It is interesting to note that while these pullbacks in the uranium stocks have been in sympathy with falling spot U308 prices, they have exaggerated the moved and still struggled even after the spot uranium price had stabilized. Fundamentally most of the companies held in the URNM are essentially the same or more advanced than they were over the last year, but now available at a much better cost basis. I’ve continued to nibble at uranium stocks the last couple of weeks, doing a lot of buying over the last couple of months.
At this point I’m about fully positioned in 10 uranium stocks within my portfolio, but if they sell off even harder, then I may move in some emergency funds to take advantage of any more downwards pressure. I find the sentiment in the uranium stocks pretty rough right now, and the companies that investors were thrilled about owning a year ago, they are now disappointed with. With a few exceptions, this isn’t company specific, but more of a sector move down, so we’ve been seeing those moments where even the best junior companies go on the clearance rack. The US uranium producers are continuing to ramp up some more production into year end and next year, and should do well at these underlying commodities prices. The uranium explorers are mostly out there with drills turning, and we should be getting solid newsflow from these companies over the next few months as a potential catalyst.
Justin Huhn, Founder and Publisher of the Uranium Insider, joined me in early August for yet another very comprehensive macro update on the supply and demand fundamentals for uranium and the nuclear fuel sector, and how the longer-term contracting cycle is setting up. Then we dig into what he is watching and how he is positioning in the uranium equities in this most recent corrective move lower in the sector. This is a longer-format follow up to our prior conversation in April, because a lot of nuclear and uranium sector news has been announced, and Justin guides us through with pro tips on how to approach investing in this sector. (in fact, this may be the longest daily editorial we ever put out on the KE Report, but it is packed with information, gets into a rapid-fire segment midway through, and then ends with a bang)
Justin Huhn – Part 2 Of Nuclear Fuels Demand And Supply Factors – Pro Tips On Investing In Uranium Stocks - August 8, 2024
We start off reviewing the flurry of news out of Kazakhstan from the largest uranium swing producer in the sector Kazatomprom. In addition to a shortfall of sulphuric acid, increased taxes on production, expected to crimp supply; and yet a surprise announcement of an increase in overall production (while showing a big decrease in their JV production for Canada with Cameco). Justin walks us through all the nuances. We also discuss the continued unstable politics in Niger making future supply still in question, along with the Australian ban on the Jabiluka uranium deposit; blocking Energy Resources of Australia and Rio Tinto (RIO) from bringing that supply online. We also discuss expectations for production output from both Cameco (CCO.V) (CCJ), and the French producer Orano, which are not expected to grow output that much over the next year or two. All of this points to a much more constrained output from global uranium producers, even in face of growing demand.
One bright spot for production is the ramping up of production from US producers like enCore Energy (EU.V) (EU), Energy Fuels (EFR.TO) (UUUU), Ur-Energy (URE.TO) (URG), Peninsula Energy (PEN.AX) (PENMF), and Uranium Energy Corp (UEC). Justin provides his thoughts on investing in US-based uranium companies, what he feels their reasonable collective output levels are, and he also discusses the pros and cons of exploration companies and jurisdiction risk in certain states.
We then delve into all the increasing uranium demand from more countries committing to expand nuclear power buildouts, along with life-extensions on existing reactors, and the role that small modular reactors could have in powering AI data centers and manufacturing or in phasing out coal plants as another demand driver. Justin touches upon the ongoing bottlenecks with regards to sourcing enriched uranium fuel and enrichment & processing due to the recent sanctions placed on Russian supplies and the waivers that utility companies are waiting for more clarity on. He also breaks down the bifurcation between the expectations and sentiment from the utility companies and nuclear fuel buyers, compared to the realities that the uranium mining companies have been forecasting; with regards to realistic future mine supply and incentive prices.
Next we get into the key larger uranium development projects in the works and just how many years from actual production all of them are; with no new projects expected to come online until 2027 at the earliest, but likely a lot longer. This review includes the Arrow Project from NexGen Energy (TSX: NXE) (NYSE: NXE), the PLS (Patterson Lake) Project held by Fission Uranium (TSX: FCU) (OTCQX: FCUUF), that is currently being acquired by Paladin Energy (ASX: PDN) (OTCQX: PALAF), and the Phoenix Project held by Denison Mines (TSX: DML) (NYSE: DNN). While these are all very robust projects, they will not be adding to global production for at least several years, which raises the question of where all the new uranium supply will come from in the interim?
We wrap up by getting Justin’s thoughts on the uranium exploration stocks operating in the Athabasca Basin and Thelon Basin of Canada, and where the biggest opportunities and concerns are from his vantage point. With so many uranium discoveries having already been made, the question is posed if any new discoveries will ultimately matter to the medium-term supply fundamentals? Justin points to the ultra-high-grade uranium discovered over the last few years at the Hurricane Deposit, held by IsoEnergy Ltd (TSX: ISO) (OTCQX: ISENF), and the potential of using the Sabre technology from Orano to extract it, and additionally Denison’s Phoenix Project. If more deposits like that can be found, then it will be impactful, and could bring more projects up the development batting order.
Oil and Nat Gas have been whipsawing back and forth, mostly in range-bound trading, and I’m not going to dissect their charts for short-term blips at this point, because they’ve been mostly trendless.
I will however include an embedded link to our KE Report weekend show interview with Dan Steffens, where he weighs in on the fundamentals of the energy sector and the oil and gas stocks that have his attention in this sector.
That’s all for this review of the resource sector, and I’ll have more articles coming out discussing gold, silver, copper, uranium, and royalty companies in the weeks to come.
Thanks for reading and may you have prosperity in your trading and in life!
- Shad

