
Commodities Update - Week In Review And The Week Ahead – Part 11
Excelsior Prosperity w/ Shad Marquitz - (04/20/2024)

As we review the commodities sector and the related resource stocks for this week, it is hard to ignore the backdrop of geopolitical tensions in the Middle East, and a general trend towards more defensive investment vehicles. The US Dollar has remained strong, where it spent most of this last week up in the 105.70-106 level. Despite the higher greenback, the commodities sector has remained strong; as investors have spent the last few weeks rotating out of intangible tech stocks, and into tangible hard assets.
This last week we saw gold remain strong despite a higher dollar and higher interest rates, hovering on either side of the $2400 price level. Silver remained well-bid in the mid $28s. Oil remained above $80 spiking up to $86 on the May futures contract and then retreating back to $83, mostly due to geopolitical news. Uranium prices remain very strong and may also include a geopolitical premium, in addition to very strong supply/demand fundamentals.
We should also note that copper has continued to break higher in a reflationary move with a lot of the other metals, which is a bid on a more robust global economy. We saw Zinc prices at the highest levels lately since last year at this time. Aluminum prices shot up to their highest levels lately since seen in January of 2023. We discussed in our last commodities review in (Part 10) that cocoa has been on a meteoric rise as well since last year to present. Other soft commodities and grains are following suit and seeing prices rise. Clearly there is a strong underlying bid for the raw commodities and natural resources that fuel our world.
These higher commodities prices will not be a boon for those expecting price inflation to keep falling, as they will filter into manufacturing, business cost inputs, and energy costs, and be passed along as prices continue melting up across most areas of daily life. Many people seem to miss the most basic point that even while inflation has slowed it’s rate of increase, things are still inflating off higher prices from the prior few years. This will eventually squeeze consumers and the economy, but we’ve also seen wage growth, and people working multiple jobs to make ends meet, so for the last few months its simply been a goldilocks zone where the economy and markets and cryptos and commodities and have all been surging higher.
Over the last few weeks we have seen a few cracks under the surface with big tech companies starting to roll over and head lower, and the US general equities and cryptocurrencies correcting downwards. Whether or not this was a warning shot across the bow that the Fed pivot party to rate cuts is finally coming to an end, and that reality and gravity are starting to set in with regards to excessive market valuations, remains to be seen. What we can say is that while most market sectors have shown weakness the last few weeks, the stand out sectors have been the industrial companies, the materials companies, and the commodities and related companies. People are turning back to hard assets.
Let’s get into the some of the individual charts for the commodities and the resource stocks to take a closer look.
Let’s kick things off with looking at the weekly chart of gold:
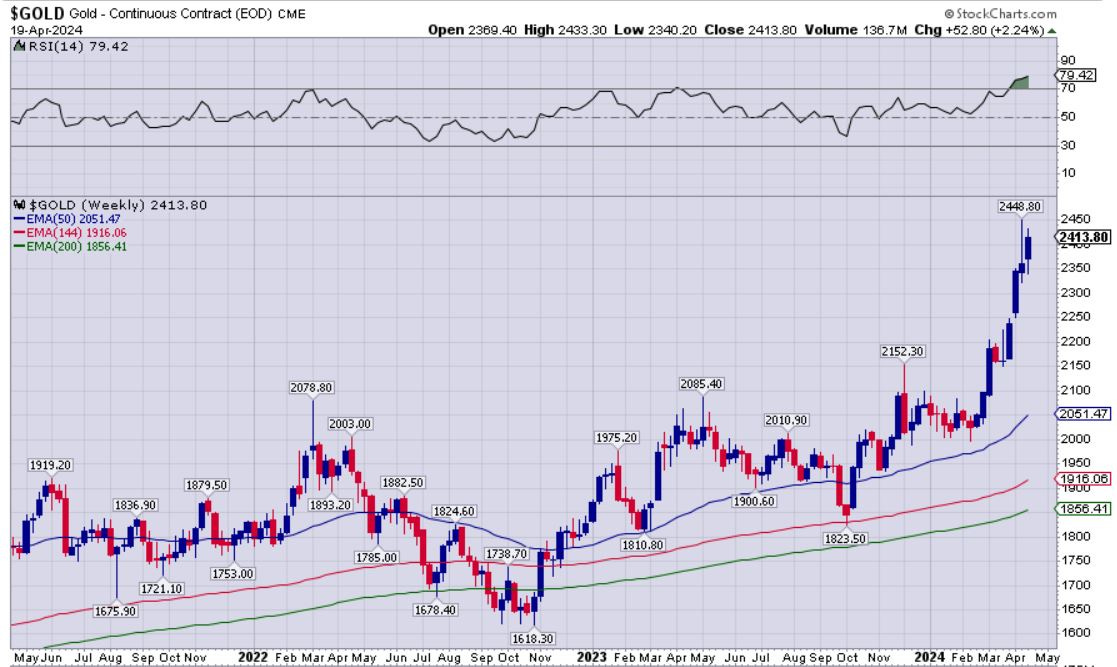
Gold has continued it’s phenomenal rise higher, closing the week with the highest weekly close ever at $2,413.80. It is well above all of the key Exponential Moving Averages (EMAs) and they are continuing to slope upwards in a bullish posture overall. Pricing is getting pretty stretched above those moving averages though, but it has ignored many technicians calls for 2 months now for it to come back and retest lower levels at $2089 or $2150 or even the round $2200 or $2300 levels. We should note though that the Relative Strength Index (RSI) is clearly up in overbought territory here (currently at $79.42 to close this week), and is at the highest level its been at for years (including at prior pricing peaks). After such a string of large bullish weekly candles, we should be prepared for an eventual consolidation of these gains and a pullback in pricing, but there is no denying that the yellow metal has been strong.
Let’s take a look at the gold stocks via the ETFs GDX and GDXJ:
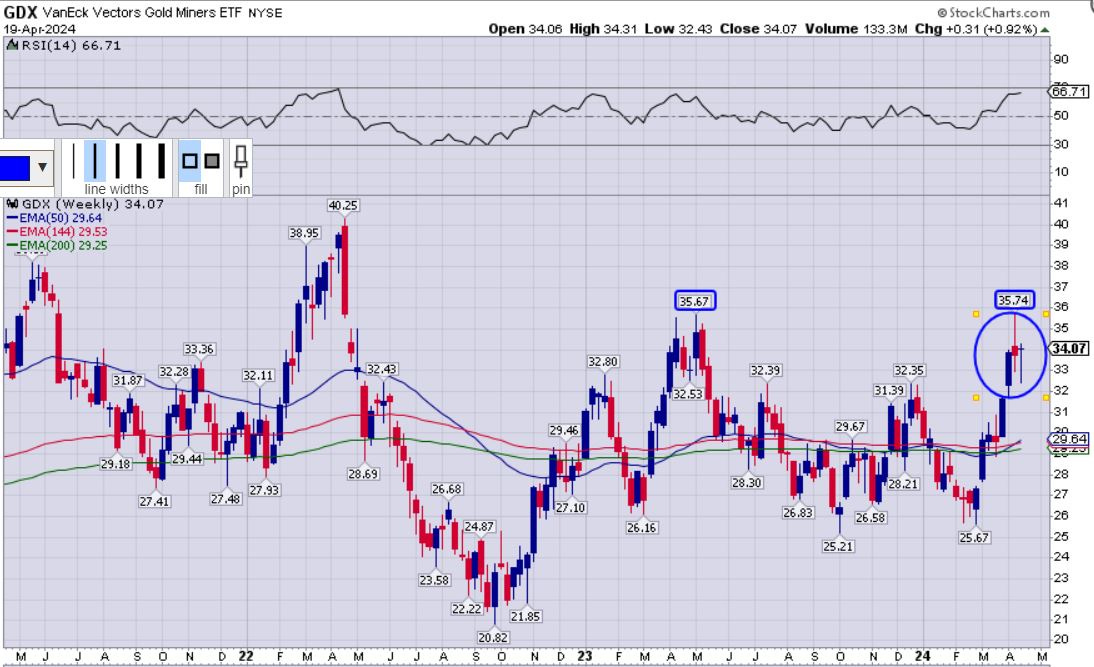
GDX did pop up 2 weeks back to put in an intra-week high at $35.74, just a smidge higher than that peak from last year at $35.67, which is bullish, and it is well above the key EMAs, where the 50-week EMA is continuing to slope upward, and pierce up through the 144-week and 200-week EMAs. However, the last 3 weekly candles show an indecision period and potentially a reversal pattern, so we’ll have to see if the companies inside of GDX finally get the memo about the higher gold prices, or whether tentative investors still full of trepidation, trim back out of positions sending the mining stocks back lower again. I’d prefer to see a really strong bullish candle breakout here to keep seeing rerating in the mining stocks, but the last 2 weeks action in particular were quite weak and muted.
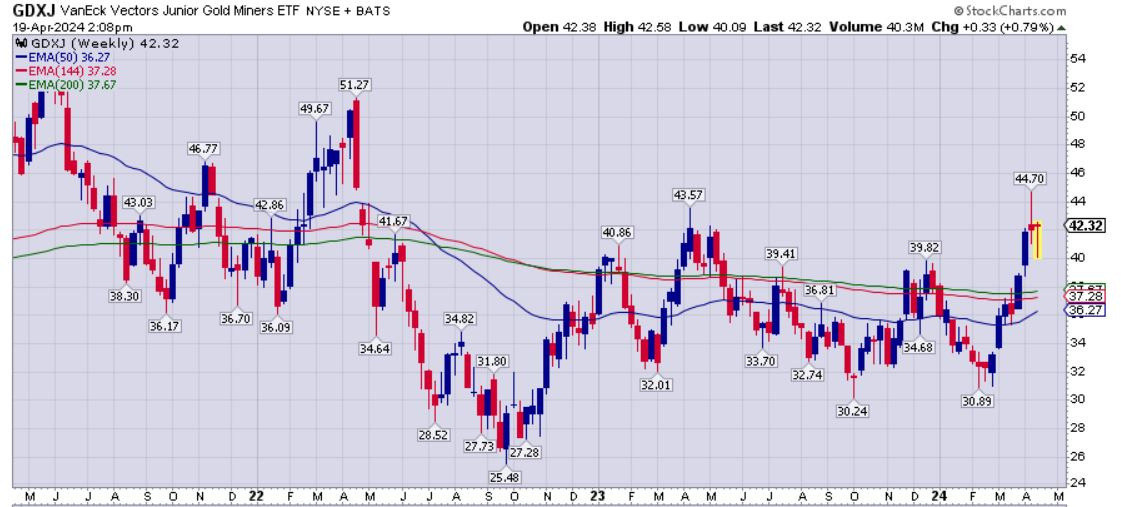
GDXJ is pretty much the exact same comments and pattern as GDX, as seen below.
Let’s shift over to the lessor precious metal, and hybrid part precious / part industrial metal, Silver.
Silver has been finally starting to wake up a little bit and showing strength versus gold, but after going up to test the key resistance at $30 two weeks back (getting up to $29.91 intra-week), it was quickly deflected back down all the way to near $28 right after that, and clawed it’s way back higher since then. Silver closed this last week at $28.84 which is a solid price for the metal and for the primary silver producers, but it is not showing anywhere near the strength that gold has over the last few years, and is still nowhere close to its’ all-time highs at $49.
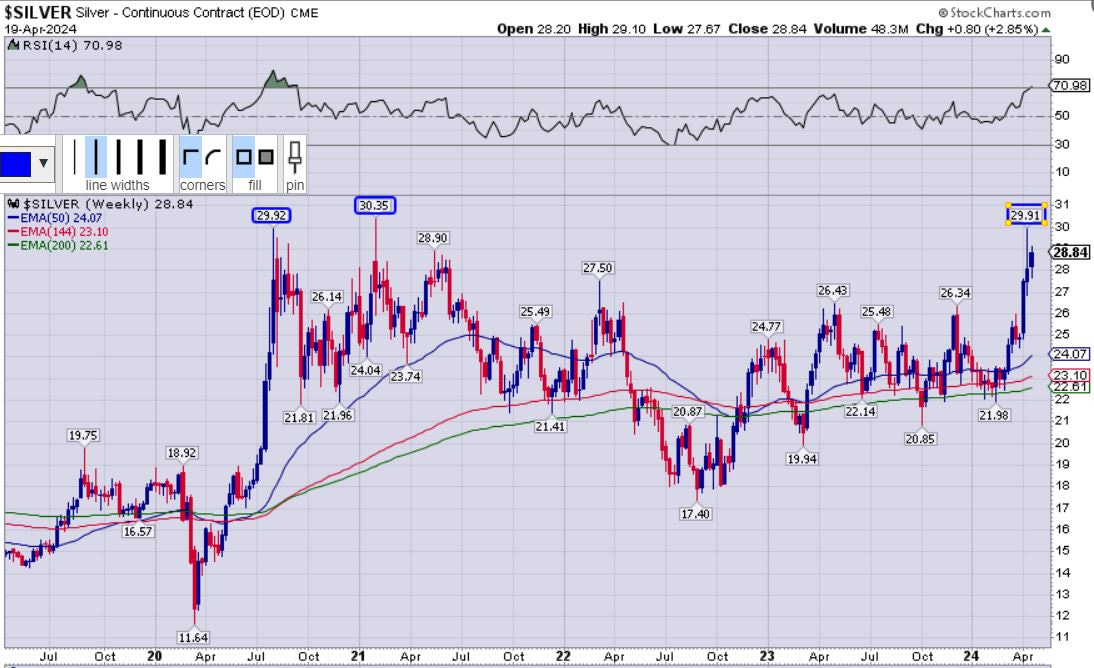
I’ve stated publicly for years now (ever since the #SilverSqueeze of Feb 1st, 2021), that we aren’t going to see fireworks in silver, or the gold or silver mining stocks until we see that $30 level line in the sand cleared definitely, and shifted from resistance to support. Even that $29.91 level hit 2 weeks back in silver, was $0.01 lower than that prior peak from August of 2020 at $29.92, and 44 cents lower than the intra-week peak from Feb 2021 at $30.35. So those are the next over-head resistance levels to clear on a weekly closing basis, and then we’d want to see prices hold above $30.35+ for a few weeks.
This type of breakout would set up a move in silver to $34-$35 in pretty short notice, as there isn’t a lot of resistance or price friction in between those areas. So even if we see a short-term corrective move in silver, that may bring in the buying and the juice for it to finally blast up through $30 and towards $34-$35. That would be the move that would awaken the animal spirits in both the gold and silver equities, and would signal a stronger leg of the precious bull markets was on in force.
Over at the KE Report we just had a fantastic discussion with our friend Dave Erfle (editor of the Junior Mining Junky) about the moves in gold, silver, and the PM mining stocks. He reiterated the same point to listeners about wanting to see silver break up through $30, but also in tandem with seeing the gold:silver ratio pull back down below 80 and start heading lower. This was a great conversation with Dave and well worth the 13 minutes to get his insights on the PM sector.
Dave Erfle – Geopolitical Tensions And Safe Haven Demand Is Driving More Interest Into Hard Assets - Apr 19, 2024
Let’s take a look at the weekly chart for Copper:
A month ago we had postulated that Dr. Copper had finally put on his dancing shoes, and the action the last few weeks has further confirmed that thesis; with a solid close to end last week at $4.50 (definitively above last year’s January peak at $4.355).
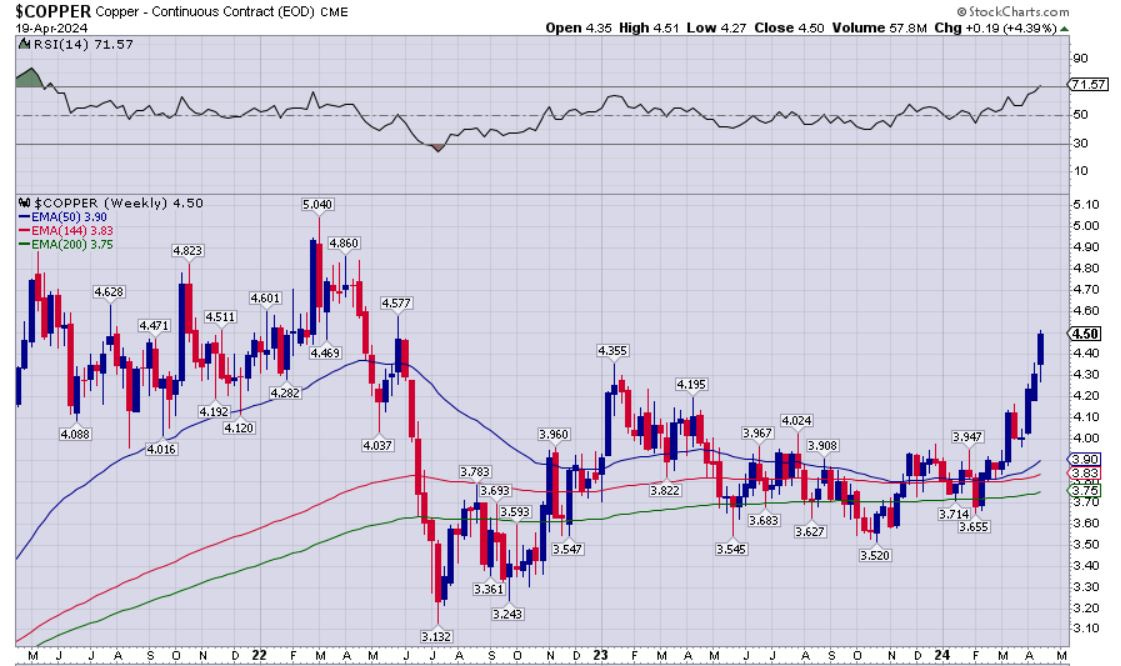
Copper is well above all it’s key EMAs and they are sloping upwards, and this weekly chart has continued resolving in a very bullish posture. Now, the RSI is getting overbought (currently at 71.57), with a high reading we’ve not seen since 2021. There is still a lot of prior pricing memory and congestion in the $4.50s-$4.60s that will be a resistance zone that may take a while for the good doctor to work through. Then there are the 2 prior peaks at $4.82 and $4.86 as next overhead resistance after that, and finally the big prize of the all-time high of $5.04 from early 2022.
So, there is a lot of work for copper to still do to really get into big momentum, but it has been very strong price action lately, and paints the picture of a more robust economy than most were giving 2024 credit for… keeping in mind the last 2 years from most economists have been a myriad of calls for the most advertised recession that never came. Maybe we still have a macro sucker-punch that is waiting just around the corner, but right now that is not what copper, or the GDP growth, or the jobs numbers (flawed as they admittedly are) are signalling.
Let’s take a look at the copper stocks via the EFT (COPX):
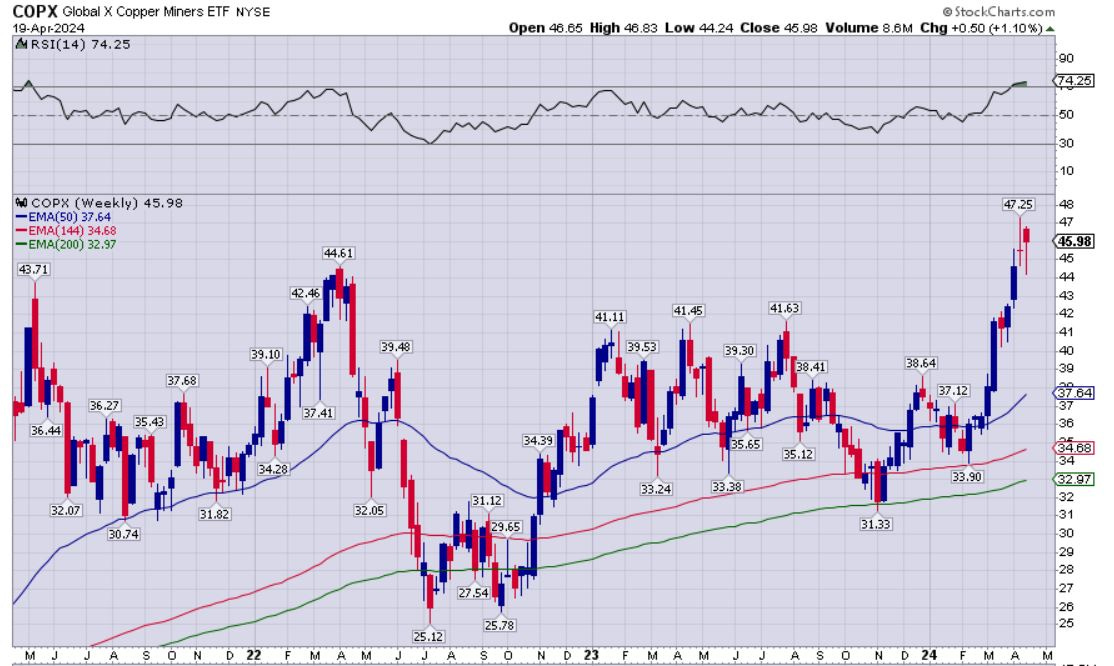
(COPX) did break out to new all-time highs over the last few weeks, getting up to $47.25, but may have gotten a bit stretched and pulled back the last 2 weeks closing this last Friday at $45.98. Still this is to be expected after such a rocketing move higher by the senior copper producers over the last few months, and the further thrust higher thus far in April. This strength has not filtered down into many of the junior copper stocks yet though, so like most of these commodities, it has been the senior producers garnering the investment capital inflows… which is what we typically see at sector turns, from bearish to bullish.
Let’s take a look at some of the energy commodities, staring with Oil.

Crude Oil WTI pricing has popped up higher from March into April back into the low to mid $80s, and did get up to $87.67, a level not seen since early last October, which has been encouraging, but it still has a lot of resistance levels and prior pricing congestion to get through in the low $90s, and then that intermediate peak from last year at $95.03 as major overhead resistance. Many market observers have been perplexed by seeing oil actually pulling back lower the last 2 weeks, despite all the geopolitical tensions in the Middle East, when many thought it had good odds of shooting up into the $90s. This is partially because of larger inventory build ups in the US and Canada, and slower demand through the “shoulder season” of the spring, until we get to “Summer driving season.”
When we look at how the senior oil producers have been acting though, in relation to oil, they are providing some solid leverage and the key ETF (XLE) has definitively broken out to new all time highs, despite oil being nowhere close to all-time highs.

The (XLE) weekly chart has been impressive for the last 4 years, showing a clear and continuous pattern of higher highs from $73.62, to $86.45, to $89.70/$89.13, to $91.38, and then recently to the all-time high at $98.97. The 50-week EMA has continued to be the area where pricing has found some support, and it has continued sloping higher, along with the other longer-duration EMAs, which is all very bullish action. The last 2 weeks have been corrective down weeks for (XLE), but the close on Friday to end last week was still at the respectable pricing level of $94.86. We’ve had a few different commentators on the KE Report over the last 2 weeks that were noting a short-term correction was likely overdue, and that shorter-term traders may want to pull profits in the larger names, and wait for a consolidation period to redeploy at lower levels. We’ll keep following along to see how things pan out, but with the geopolitical uncertainty both oil and oil stocks are likely to stay volatile in the near future.
Let’s check in on Nat Gas:
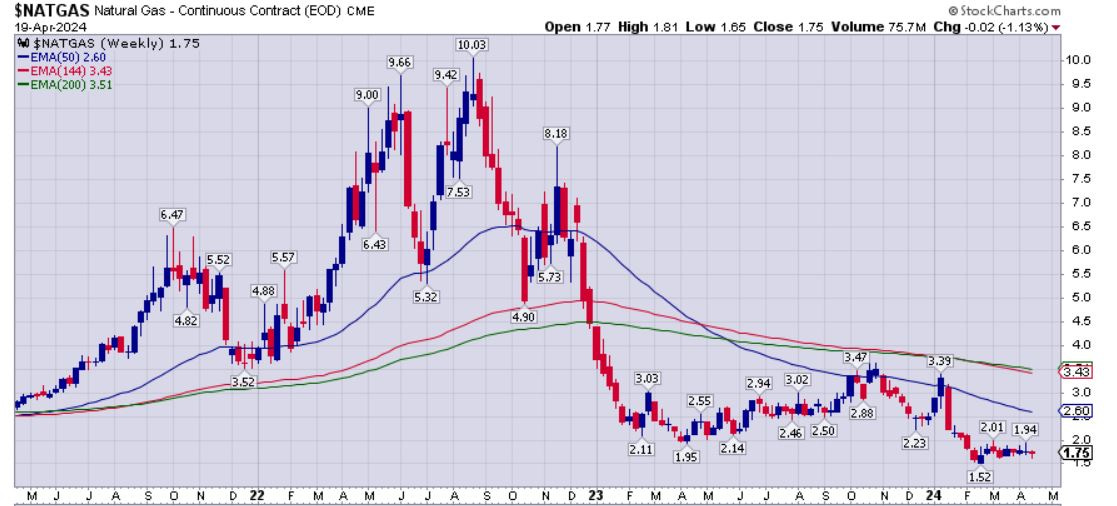
There is not really much to say about Nat Gas, when looking at the chart, as pricing has been channeling sideways between $1.50-$2.00 for several months now, and the close on Friday at $1.75 was smack in the middle of the price range. Many investors are expecting to see an uplift in demand, and thus pricing, in the latter part of 2024, once some of the LNG terminals in Canada and the US start coming online for export to Europe and Asia. However, the markets are forward-looking and don’t seem to be front-running this uptick in pricing at this time. Natural gas and the related natty gas stocks, may good contrarian bets for the second half of 2024, and I’ve started positioning in Birchcliff Energy (BIR.TO) (BIREF) as an early entry into this sector. I have on my radar a few other companies like Antero (AR), EQT Corp (EQT), and Comstock (CRK) as a few other nat gas companies I may start positioning in while the methane gas is under $2.
Let’s wrap things up with a quick look at the Uranium stocks via URNM for a sense of how things are trending in the sector. I’ll have a bigger uranium update coming out sometime in the next week or two, so stay tuned for that; where we’ll dive in a bit more granularly to the companies and the overall sector once again.
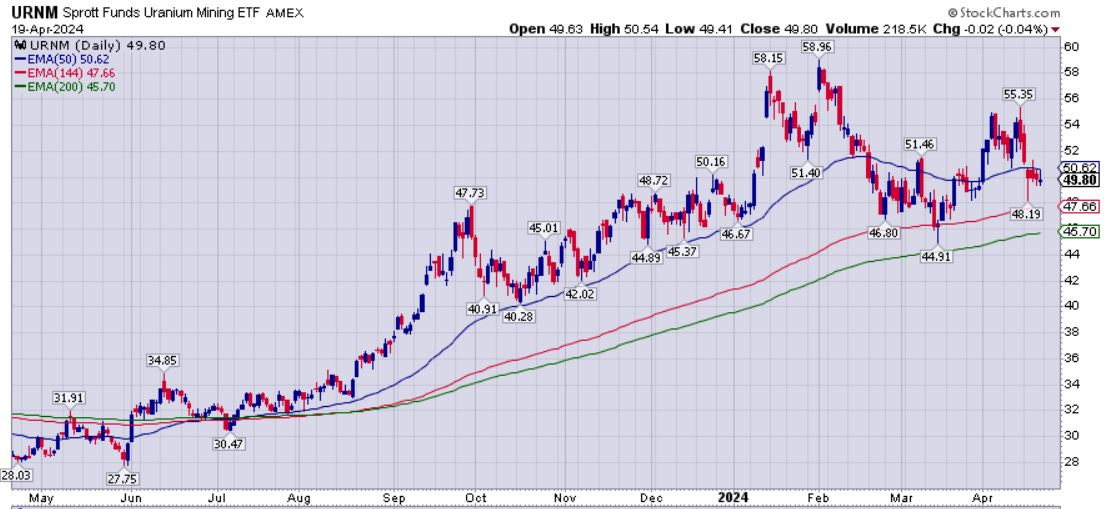
(URNM) has seen pricing continue to be drawn to the 50-day exponential moving average like a magnet, either as support or resistance, and the 144-day EMA has offered support on price dives lower. I had mentioned 2-3 months ago, that I had starting pulling profits in late January and early February, and that a corrective move in the sector was long overdue. That seems to be all we are getting (a consolidation), and I’m still very bullish longer-term for the sector and uranium stocks. However, with pricing closing the week at $49.80, below the 50-week EMA (currently at $50.62), then it is still a mildly bearish posture. Also the pricing just dove down to $48.19 closer to the 144-day EMA again which is not strong bullish action.
I see the big support remaining to be the 200-day moving average down at $45.70 on any further weakness, and have messaged repeatedly, that if pricing got back down near the 200-day EMA again, that I’d add back to some of the positions I’ve trimmed. I still have 7 equity positions in place in the U-stocks, and if things rip higher again, then I’ll be absolutely thrilled to keep riding things higher in those core positions. However, I’d love the opportunity to add to those positions at lower levels if we see them in the weeks and months ahead. Again, I’ll have more thoughts on how I’m looking at trading my own portfolio in the next Uranium-focused update in the next 2 weeks or so.
That’s it for today and thanks for reading. May you have prosperity in your trading and in life!
- Shad