
Commodities Update: Silver, Copper, Uranium, Oil, Nat Gas
Excelsior Prosperity w/ Shad Marquitz – 04-13-2025
It’s time for an update on the commodities sector, after a very volatile last couple of weeks in all markets. We’ve spent a lot of time lately taking a closer look at gold and the gold equities; and rightly so because they’ve been blasting up to new highs. However, as resource investors and market observers, it is also important to keep tabs on opportunities and pricing trends in the larger commodity complex.
We are mainly interested in these trends to capitalize on the companies exploring for and extracting these raw materials for a profit. This article will be more of a snapshot of key pricing developments in silver, copper, uranium, oil, and natural gas and the related equites. Then in future articles we’ll continue to take deep dives into each of these specific sectors and opportunities in specific stocks.
So, let’s get into it…
First let’s have a look at the whipsaw chart of silver futures.
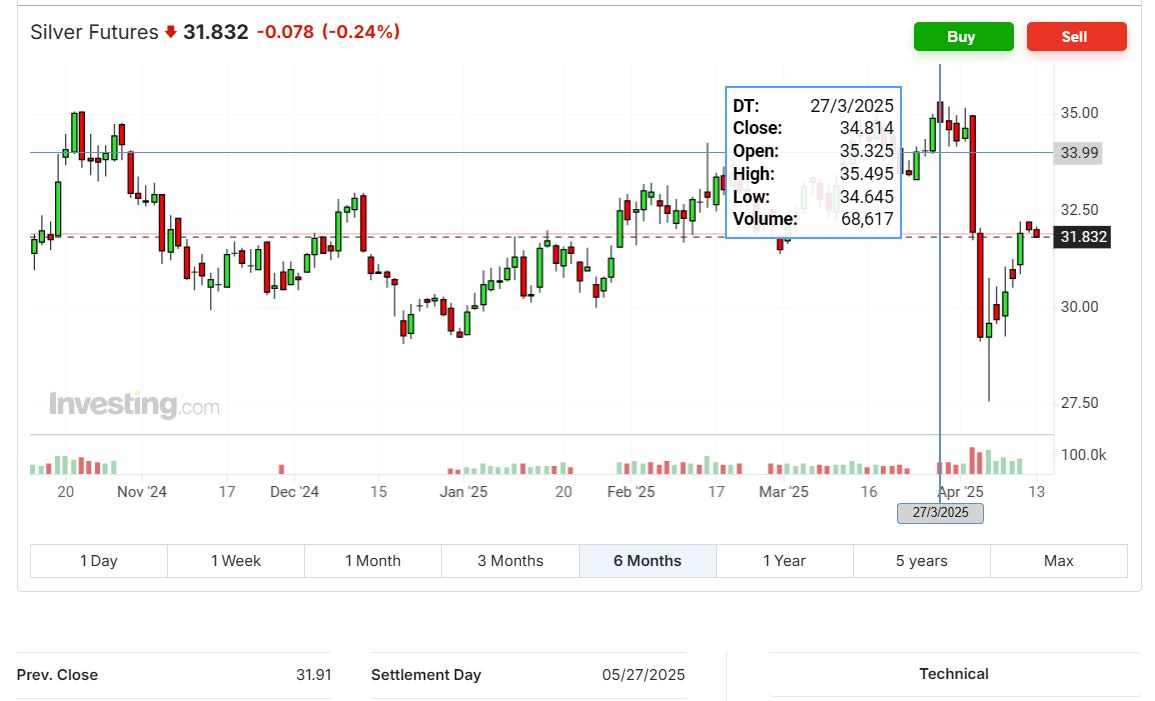
Silver went on quite a run in the first quarter of 2025. It broke up to the highest level in over a dozen years, hitting a peak of $35.495 (let’s just call it $35.50) on March 27th, just a few weeks ago.
That $35.50 level tagged was definitively above the October 22nd high water mark last year at $35.07, but unfortunately it couldn’t hang onto that level on a closing basis and it was over just a quickly as it happened.
Silver’s highest daily close last year was on October 21st at $35.04, but in the move up this year the highest daily close achieved was on March 26th at @$34.905. So when looking silver futures on a closing basis, the move up this year did not eclipse last year’s level which was disappointing. Since then pricing has pulled back significantly lower again.
Silver futures pricing was absolutely torpedoed on April 2nd, when the Trump tariffs were announced, in a big red candle lower, and then pricing also dropped bigly on April 3rd in another big red bearish candle.
Friday April the 4th was another big down day earlier in the session where silver got all the way down to $27.55, but then a huge reversal took place where silver shot up as high as $30.76. It closed 2 Fridays’ back at $29.60, and has been on a gradual move higher since then…. which is encouraging.
Fast-forwarding a week up to last Friday April 11th, we saw silver futures close at $31.91 on the May contract. (as noted at the very bottom of the chart above with “previous close). That was a higher weekly close than the prior week and things have been trending a bit better for silver. Looking for more follow through.
Silver bulls will want to see pricing get back above $33 overhead resistance, and really it would be best to get back up into the low to mid $35’s on a daily and weekly close. Additionally, it would be quite bearish if silver was to break below lateral pricing support in the $29.23-$29.20 level on a closing basis.
Let’s check in on the silver stocks by way of the ETF (SILJ):
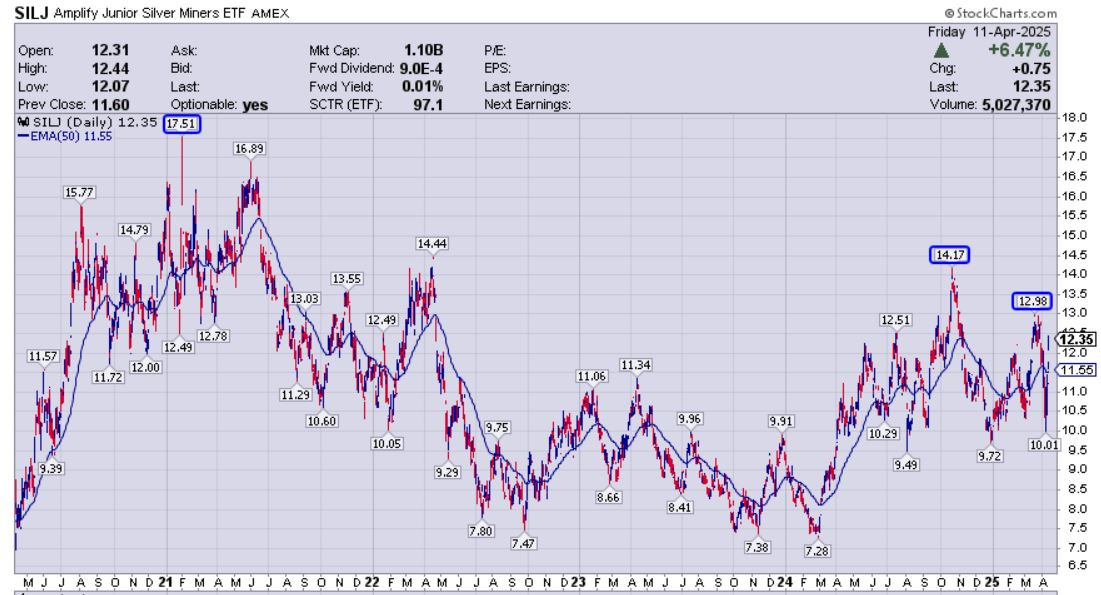
During the #SilverSqueeze on February 1st 2021 SILJ got up to an intraday high of $17.51. At that time silver futures got up just over $30.
Last year there was a solid run higher in the silver equites when silver got up to a new recent peak in October of $35.07. SILJ hit a lower higher of $14.17 last fall, and was unable to eclipse that move from 2021, even though silver was about $5 higher and margins were better for the silver producers. I pointed this out at the time and was a bit underwhelmed at the market response to the highest silver prices we’d seen in over a decade.
Last month in late March silver prices hit an even higher level, and yet the SILJ made another lower high only making it to $12.98 this time around. Pretty underwhelming.
Readers of this channel know that I’m a big silver mining bull, holding 19 silver stocks at present in my resource portfolio. Don’t get me wrong here, I’ve invested big in this sector because I believe it will eventually outperform. However, when looking at the SILJ chart it really has been pretty lackluster. This clearly demonstrates that uber-bullish sentiment is still not there yet in this sector to push up the valuations in the silver stocks to where they should be, considering silver has hit $35 twice in the last 6 months.
Now, there are individual stocks that have outperformed, and that is why this remains a stock-pickers market, and not a dart-throwers market. We’ll continue to cover the stocks in this channel that should and are providing that extra upside torque.
Next let’s take a look at the rollercoaster ride on the copper futures chart.
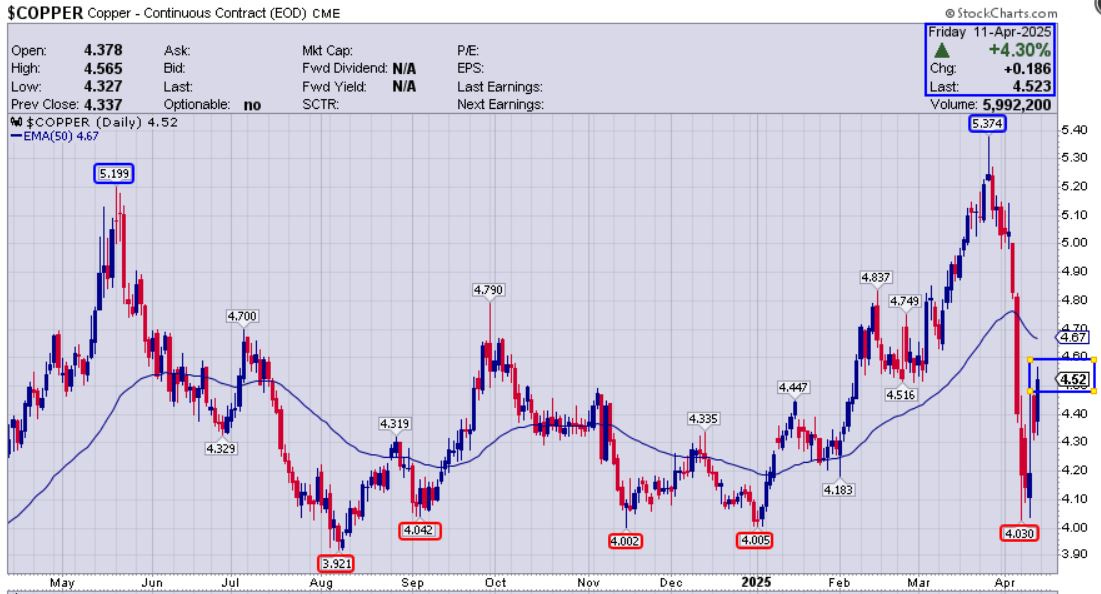
We had noted earlier in the year that Dr. Copper was starting to dance like nobody was watching. Copper futures prices climbed up out of the mid to high $4’s and went up to close on March 25th at an all-time high of $5.21 (after hitting an intraday high of $5.374).
That close a few weeks ago was a higher close than the prior all-time high of $5.199 in May of 2024, which was very significant.
However, just like with silver, right after it hit the highs in late March, copper reversed down sharply once the US tariff policy news was announced, diving down all the way to $4.03. That was an absolutely huge move in copper in just a couple weeks and sucked all the air out of the room. Sentiment went from euphoric to despondent so quickly that most investors didn’t even remember the all-time high was just tagged a few weeks back.
Copper seems to have good support down just above $4, as evidenced by the series of prior lows at $4.042, $4.002, and $4.005 (noted by red rectangles on the chart above)
Last week copper started near this recent low and gradually climbed higher for the balance of the week to close up at $4.52 in a snapback rally.
These have been really big moves in copper futures over the last month. Even though the red metal has a history of being quite volatile, this action lately is enough to make one dizzy just trying to follow along. Chill out Dr Copper…
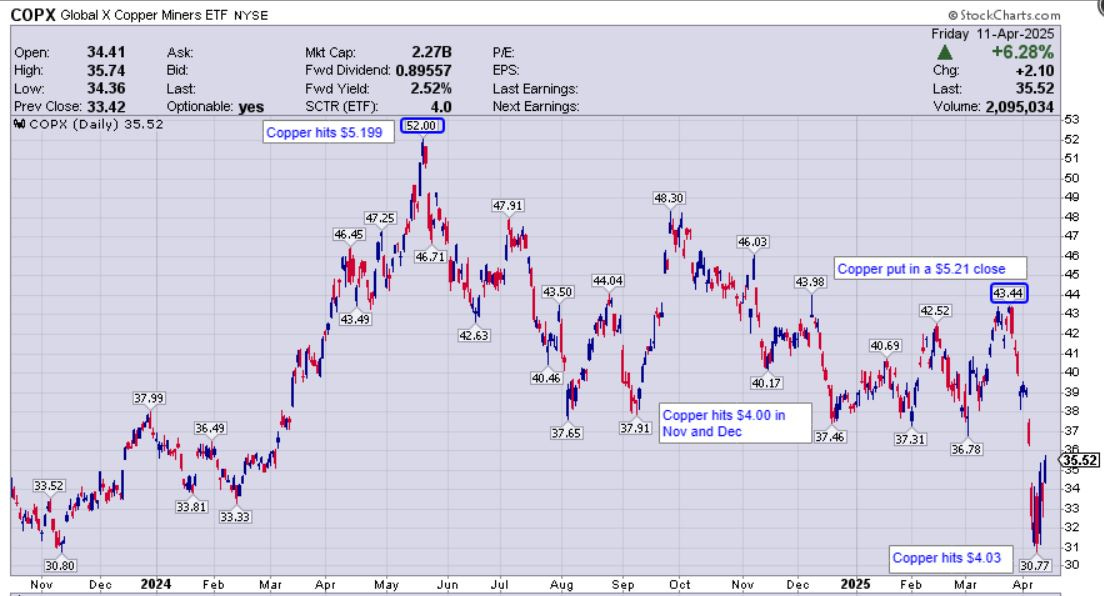
The copper stocks really got hit hard, and may be presenting a compelling spot to accumulate into this recent weakness (more on that in future articles).
For now, just have a look at how the copper producers inside of the Global X Copper Miners ETF (COPX) really didn’t react much to the new record high copper price in March, but sure fell out of bed during the correction so far in April to far lower levels than the exact same pricing last year.
Now let’s review the long fall from grace in the uranium spot price for over a year:
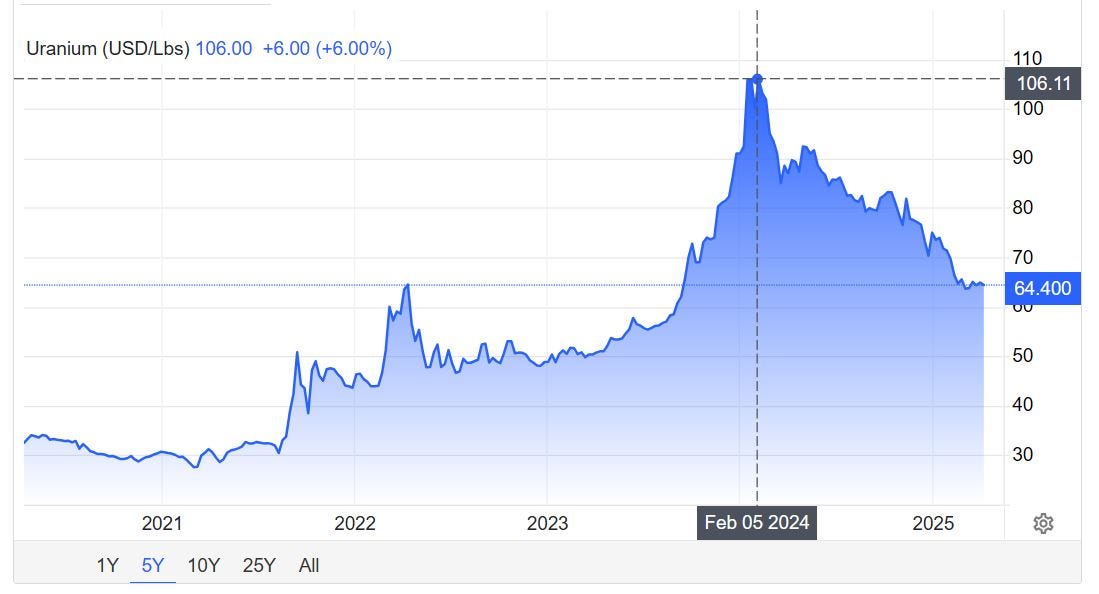
We’ve noted in prior articles on this channel that uranium pricing has had a number of tailwinds at it’s back for a handful of years now. U308 spot pricing rose from the high $20s and low $30s back in 2021 all the way up to triple digits in early 2024, eclipsing $106 in both January and February of last year.
Pricing has slid all the way back down in the mid $60s lately, with the most recent reading at $64.40 the second week of April. The same fundamentals are all still in place… nothing from a big picture standpoint has changed.
Uranium pricing is different than any other commodity. There are no futures prices, and the spot price is really for small transactions placed in that market, which makes up about 25% of the uranium sold.
The lion’s share of yellowcake pounds that get sold are facilitated through longer-duration “term” off-take contracts. This is where utility companies or other buyers of uranium contract directly with uranium companies for their material at set prices, flexible market-based contracts with floors and ceilings, or with other nuanced provisions over multiple years and even up to a decade.
The term price is still somewhere in the vicinity of $80 at present, but it really is a very opaque market where many transactions and contracted prices are not publicly disclosed. The point is the term price is more important than spot.
The uranium equities have very volatile reactions in pricing based on swiftly shifting investor sentiment, and at times behave in ways that are irrational and erratic.
For example, the biggest bull market move we’ve seen in many of the established uranium equities was back in 2021, when uranium prices moved from the high $20s up to over $50. Many of the more established uranium stocks went up 8x, 10x, 20x, and some juniors went even higher on that move.
Then in 2022 when U308 prices simply moved back into the mid $40s, many stocks fell by 30%, 40% or more… on a 10-15% change in the spot pricing.
Then there was another big run higher in the 2nd half of 2023 through early 2024 when prices moved from the low $50s to over $100, but the stocks went up 3x, 5x, 10x, outperforming once again.
Ever since those highs uranium prices have gradually dropped since February of 2024. The uranium equities have continued to outperform, but to the downside.
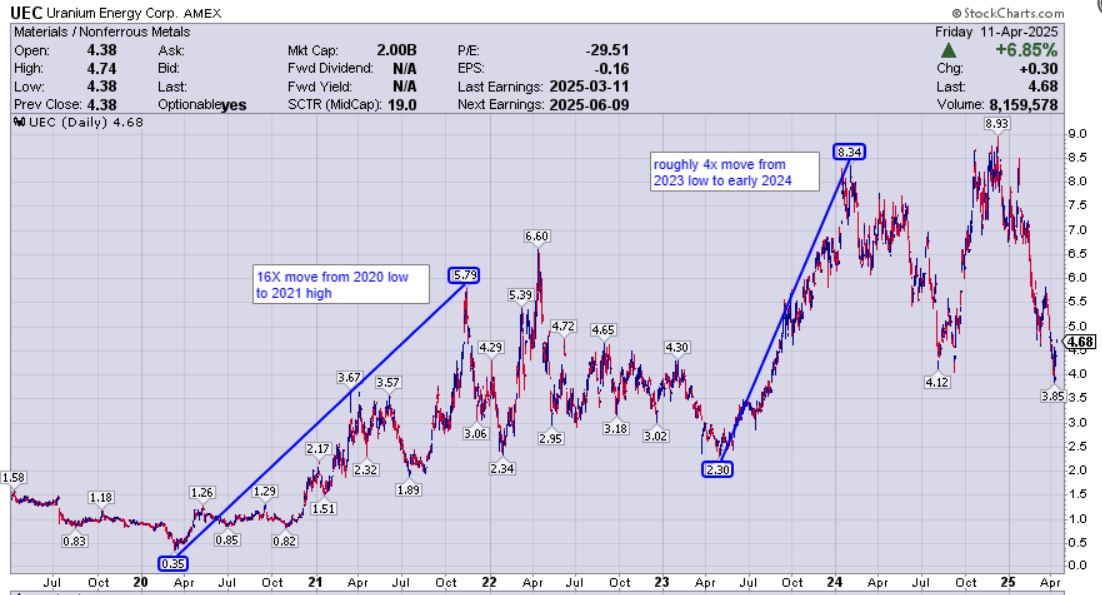
Just have a look at the chart of Uranium Energy Corp (NYSE American: UEC) below as an example of the kind of out-sized moves that uranium stocks can make in relation to spot pricing and investor sentiment.
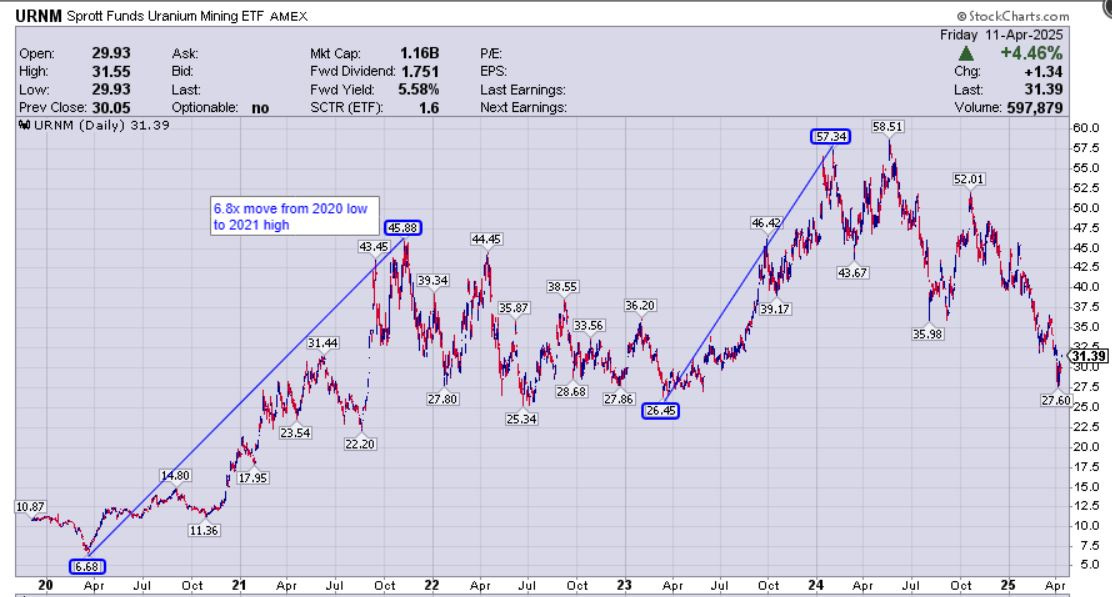
Even the diversified ETF (URNM) had similar types of outsized moves:
After the brutal 1 year correction in uranium equities since May of 2024, the U-stocks are at a valuations that are very attractive for accumulating from my perspective. I’ve been doing just that in my portfolio over March and April adding to positions in a number of the highest quality developers and producers like UEC, enCore, Ur-Energy, Energy Fuels, NexGen, and Denison. (not investment advice, just sharing my personal thesis and what I’m doing with capital in my own portfolio).
Now, onto traditional energy with a look as the WTI Oil price action lately, where it is back down to levels not seen since 2021.

The fall in oil prices below the recent trading range is curious, but plays into expectations for a slowdown in global growth, OPEC+ messaging on raising production guidance to match where it actually was, and more overall supply than demand. This may be an overreaction to the downside but we’ll see in time.
This drop in oil prices should at least help moderate some components of inflation and lower costs for businesses, consumers, and the input costs of many mining companies. However, it has been kryptonite for the oil stocks.
Have a look at the dramatic recent crash in oil producers by way of the (XLE):
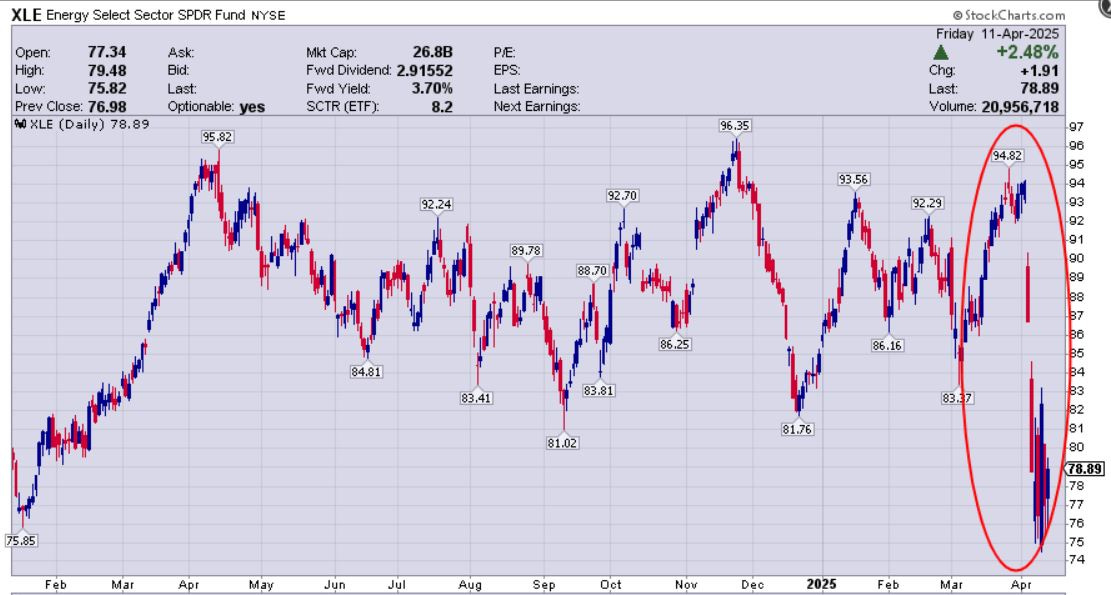
These oil and gas producers have corrected to such a degree, that many individual companies are offering very compelling accumulation points in my opinion. For me personally, I’ve been so preoccupied in trading the metals stocks that I’ve not really pounced on any of these discounted bargains yet in the energy stocks. Looking at a chart like that does ring my bell for a potential contrarian trade soon. I’ll keep readers posted if I take action and start nibbling.
We’ll wrap things up with a look at the natural gas daily chart:
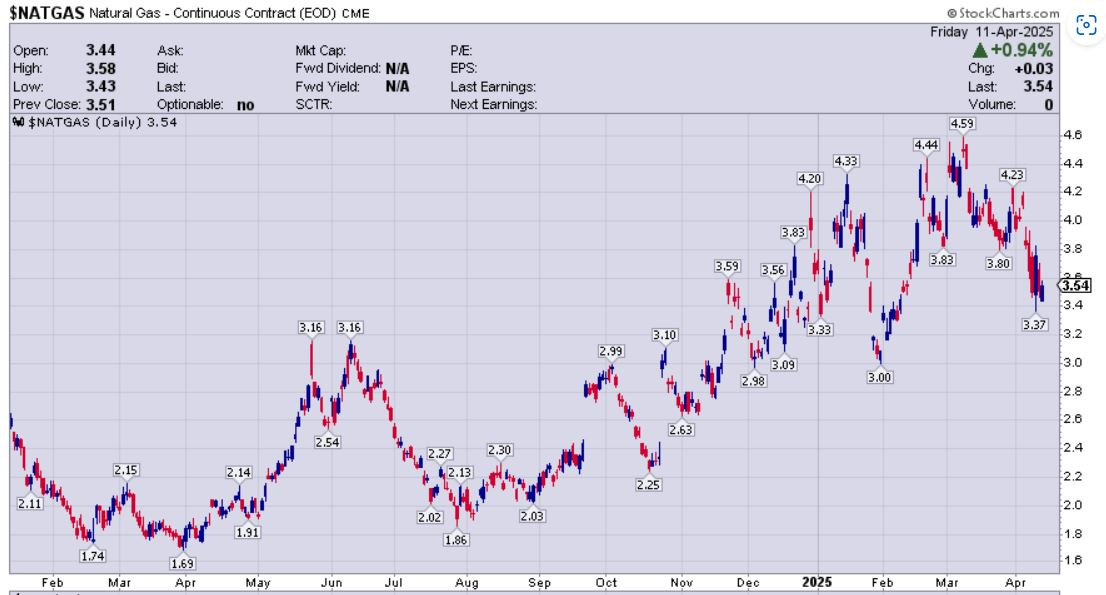
Nat gas went on a tear higher from last summer at the August low of $1.86 to blast up to a peak of $4.59 about a month ago in early March.
Pricing closed last week at $3.54, which is still well above where pricing was a year ago at that April 2024 low of $1.69.
This commodity is always very volatile and a whipsaw chart, but the trend has been up for a while, and it could be that pricing is just putting in another “higher low,” setting up for the next leg up. If pricing were to break below that $3.00 trough hit earlier this year, then that would be more concerning. I’m anticipating seeing pricing back with a $4 handle in the medium term, and eventually a $5 handle later this year. (more to say on that down the road…)
Thanks for reading and may you have prosperity in your trading and in life!
Shad