


Commodities Update – Gold, Silver, Copper, Uranium, and Nat Gas
Excelsior Prosperity w/ Shad Marquitz 01-11-2025

1-Year Daily Chart Of Gold Futures:
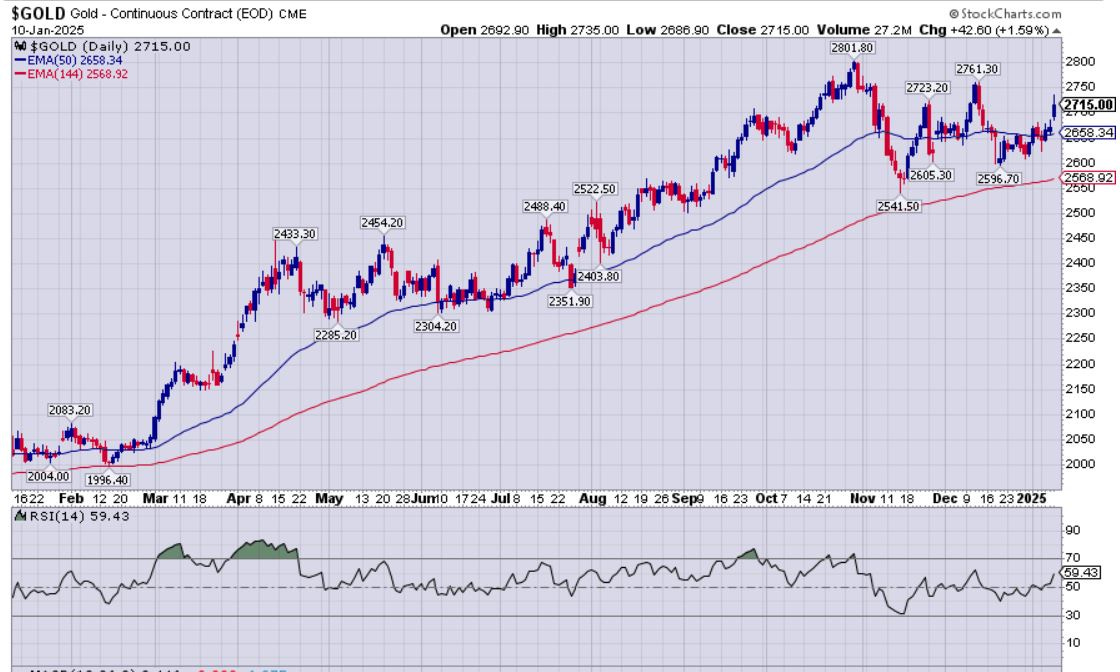
Like we have discussed, (really for the last 2 years), gold’s chart remains a thing of beauty. In general pricing respects the 50-day Exponential Moving Average (EMA). Yes, it has occasionally dipped down briefly near the next support level at the 144-day EMA, but then it quickly moves back up above the 50-day EMA.
Pricing closed on Friday at $2,715, which is above the 50-day EMA (currently at $2658), and it remains in a bullish posture. (Also $2700 gold is a great price!)
The RSI is trending back up, but is still in neutral territory (currently at 59.43), so gold could keep heading higher and still not be overbought.
The next resistance levels are prior peaks at $2,723.20, $2,761.30, and the all-time high close of $2801.80.
With regards to gold mining stocks, it seems more appropriate to look at things through the lens of GDXJ, because the components of GDX are too skewed by the outsized weighting that fund gives to big boy laggards like Newmont and Barrick; each with their own respective challenges to sort out. As a result their drama and underperformance last year has warped the performance of GDX.
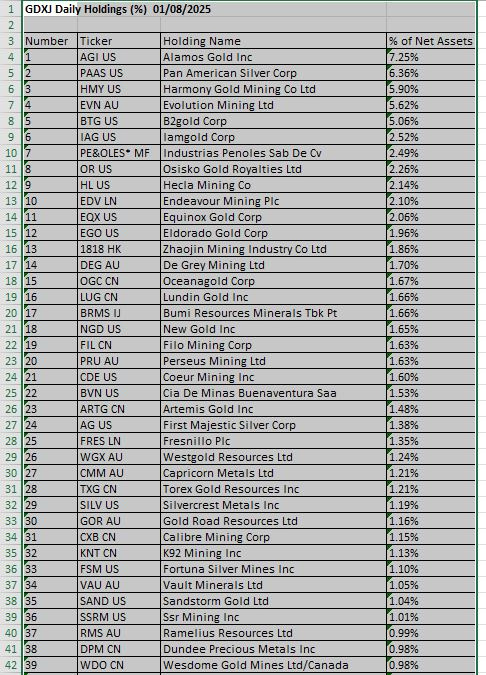
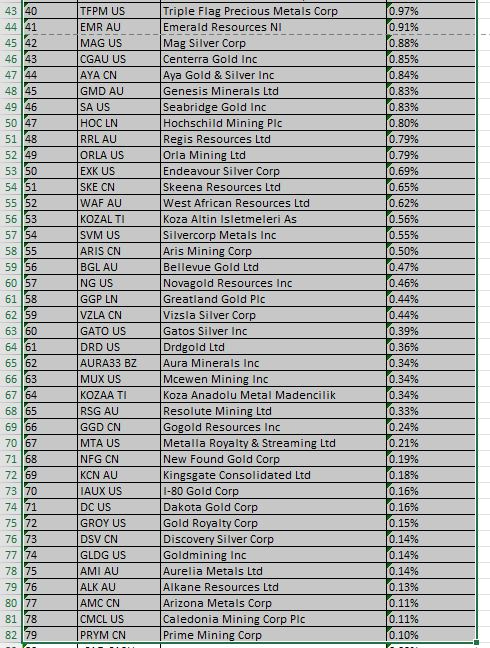
For this weekend, I decided to get under the hood and look at the recent holdings within GDXJ: While they are definitely not “junior” gold stocks in the traditional sense, there are still a lot of solid quality gold and silver mid-tier producers and some of the largest developers included, so it is a better sample size of the broader precious metals equities space.
It is still amazing and disappointing that a supposed gold junior mining ETF is not really full of gold juniors; and strangely also has an abundance of silver stocks inside of it. While the name and stated purpose of the fund is misleading, it still is a nice mash-up of 80 different gold and silver stocks, and a better barometer of the health of the overall mining sector than GDX.
As far as the weightings, leading the charge is Alamos Gold at over 7% (which makes sense as the king of mid-tier producers), and then other big 5%-6% weightings are Pan American Silver, Harmony Gold, Evolution Mining, and B2Gold. If one scans down the rest of the list, one will recognize dozens of other household names in the gold and silver space.
It is important to look periodically at what exactly is inside of an ETF, to know what one is even tracking by posting a chart of its price performance.
GDXJ Daily Holdings (%) 01/08/2025
Now let’s have a look at the VanEck Vectors Junior Gold Miners ETF (GDXJ) Chart:
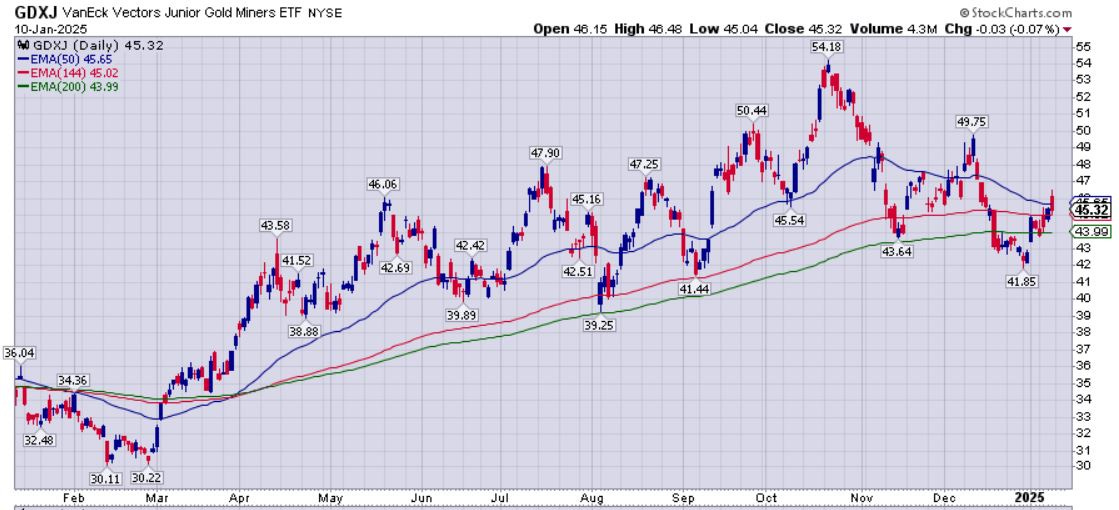
This GDXJ chart is not nearly as bullish of a chart as that of gold. It highlights the repeated observation of the gold & silver stocks underperforming the typical 2x-3x leverage the equities have to the underlying metals. Having said that, GDXJ had a nice run last year off it’s double-bottom lows in February of $30.11 and $30.22, and then blasting up 79% to $54.18 by mid-October, before dropping down nearly 23% to the December low of $41.85. What a ride!
One can see that pricing was generally above the 50-day EMA (blue line) most of the year, and occasionally would dip down to test the 144-day or 200-day EMAS and quickly recover. However, that December breakdown was more ugly, and caused more chart damage, as it sunk definitively below even the 200-day EMA; which is classic bearish action. The shorter term pattern of lower highs and lower lows since the mid-October peak has also been bearish. This may be changing…
The good news is that so far in 2025, the GDXJ has launched back up retaking the 200-day and 144-day EMAs, and is working on getting back up above the 50-day EMA and holding it.
Friday’s close at $45.32 was a bit below the 50-day EMA (currently at $45.65), so in the week(s) to come, bulls will want to see that level eclipsed and held on a closing basis for a few days, to start getting the pricing action in a more constructive setup.
Let’s next have a look at Silver future’s daily chart:

Unsurprisingly, the silver pricing chart looks a lot like the gold and silver equities charts, as the stocks actually tend to track the moves in silver, more so than the moves in gold. Silver likewise had a positive 2024, spending much of the year in a bullish posture up above the 50-day EMA, and occasionally coming back down to test either the 144-day or 200-day EMAs.
Like the PM mining stocks, Silver topped out in mid-October at $35.07, (a level it had not been at in a dozen years), but quickly reversed course back down in a pattern of lower highs and lower lows down to the December bottom at $29.15.
Silver prices appear to have double-bottomed around the 200-day EMA support, and have started to climb back above key moving averages. Friday’s close at $31.31 (cosmic) was above the 50-day, 144-day, and 200-day EMAs to close the week, putting it back into a bullish posture… but just barely so. Bulls will want to see more follow-through in the weeks to come and for pricing to stay above that 50-day EMA and build some upward momentum.
Let’s check in on the good doctor, Dr. Copper and have a look at the 1-year daily chart:
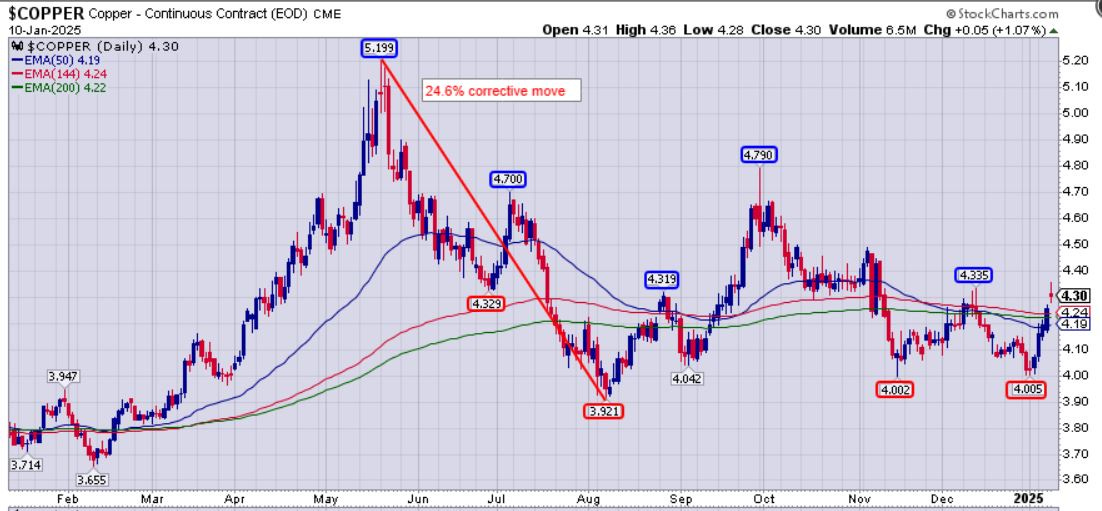
Copper has a really messy and lackluster chart overall. Yes, it was encouraging to see copper prices put in an all-time high last year at $5.199. We had noted in the early spring that Dr. Copper had put on his dancing shoes… and it was quite a dance! However, once the music stopped pricing dropped by 24.6% down to the August low of $3.921, sucking all the bullish wind out of the room. Since then copper futures prices have been whipsawing investors back and forth on either side of the key moving averages.
It does appear that copper may have put in a double-bottom at $4.002 in November and then again at $4.005 to ring in the new year Dec 31st. Often times, as noted on prior charts above, a W-shaped double-bottom can be a solid base to build the next rally off of. Bulls will want to see that confirmed by more follow through in the weeks to come by popping above lateral price resistance.
There are 3 prior troughs and peaks at $4.329, $4.319, and $4.335, (making a lateral pricing resistance zone at $4.32-$4.34) that bulls will want to see copper futures clear definitively on a closing basis to get more bullish momentum going. After that the next key overhead resistance zone is created by the prior peaks at $4.70 and $4.79. There is a lot of work to do before making another test of the all-time high at $5.199. One step at a time…
Friday’s copper price close of $4.30, was above the key 50-day, 144-day, and 200-day moving averages, so it has just moved barely back into a bullish position. It was a very weak looking leg up though, with a red “doji’ indecision candle to end the week. It is a bit too early to start celebrating the break higher at this point, but it was at least a constructive technical step higher.
Most copper seniors and juniors have been in the hurt locker for the second half of 2024, but the conditions are present for them to stage a comeback out of the negative sentiment and if there is a bigger rally in copper. I’m neutral on the this copper sector at present, and in the short-term not really bullish or bearish. (one doesn’t always have to be a raging bull or bear on a sector)
Sure, there is the opportunity for a nice rally and to add to positions in quality copper stocks at good valuations here, and in the longer-term, these valuations will likely look cheap. However, the macro conditions with China’s economic woes could drag on mixed with a potential slow down in global economic growth, and those economic factors could keep the copper demand and pricing muted and the doctor on the sidelines. As people in this channel know, I’m very bullish on the longer-term drivers for the copper market, but it is going to be a process. We’ll be watching for a definitive move one way or the other, but feel there are better opportunities in other commodities until the pattern changes.
With regards to Uranium, because of the divergence between spot and term pricing, and the opaque nature of the pricing market compared to commodities like gold, silver, or copper, then we’ll just dive right down into the uranium equities.
Here is the 1-year daily chart of the Sprott Funds Uranium Mining ETF (URNM):
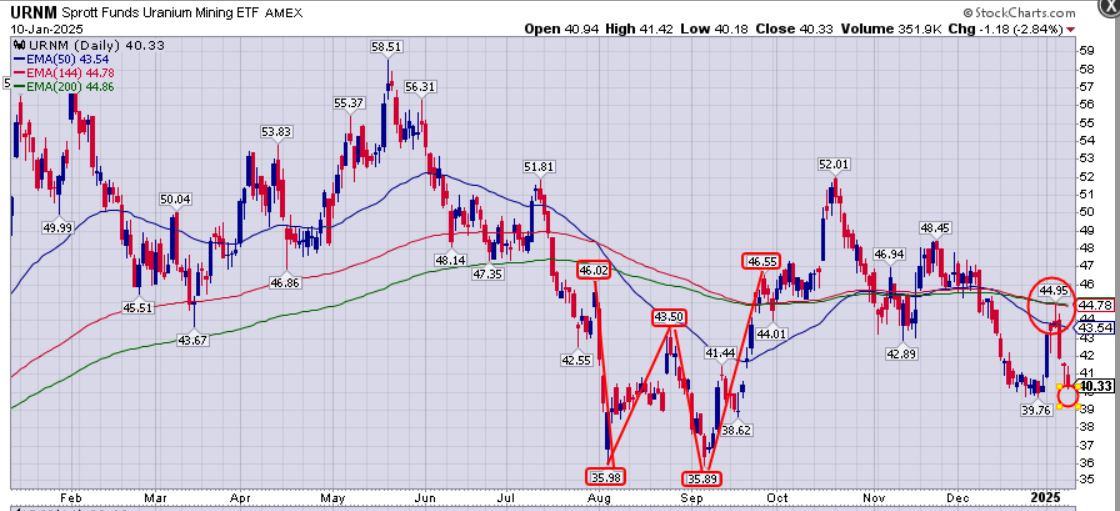
This is another messy and somewhat ugly chart for (URNM). In prior years the pricing was respecting the key moving averages as support versus last year when they shifted back to resistance. It did look like it double-bottomed in that W-shaped pattern in August and $35.98 and then again in September $35.89, but after breaking up above that right side of the W at $46.55, and surging up to $52.01 in October, it has fallen back out of bed again.
In December pricing corrected all the way back down to $39.76, which is still above the double bottom lows of last year, but bulls will want to see that level hold. Friday’s close of $40.33 is getting dangerously close to the December low. If that support level were to break, then last year’s lows come back into focus.
The recent January rally up to $44.95 ran right into resistance at the 144-day and 200-day EMAs and was swatted right back down again; with pricing sinking down through the 50-day EMA as well. Uranium stocks bulls will want to see pricing regain a solid position above all those key moving averages again.
Having said all that, and noting the technical work that needs to happen next in URNM pricing… I’m still very bullish fundamentally on the uranium sector with the supply/demand fundamentals in favor of pricing continuing to escalate to the upside in the year(s) to come.
So this is somewhat similar to copper in that sense, with good fundamental macro drivers and supply/demand drivers in the longer-term. However, in the case of uranium, I see fundamental drivers in the medium-term as well, over the next 6-12 months, that should lift contract pricing, term pricing, and even spot pricing higher, and give some new fuel to the U-stocks.
This week over at the KE Report we had 4 very engaging discussions that eventually touched upon gold, silver, copper, and uranium, along with other commodities, sectors, and macroeconomic movers.
Nick Hodge – Macroeconomic Themes In 2025, Opportunities In Gold, Uranium, And Copper Stocks – More Technological Innovations In The Mining Sector
January 8, 2025
Sean Brodrick – Good Setups In Gold, Silver, And Uranium Stocks – Opportunities Amidst The Coming Volatility In 2025
January 7, 2025
Weekend Show – Dave Erfle & Dana Lyons – 2025 Outlook For Metals Investors, Equities and Technical Analysis
January 11, 2025
One other commodity that is worth noting, based on how pricing has continued to ratchet higher is Natural Gas. It has really been on fire lately!
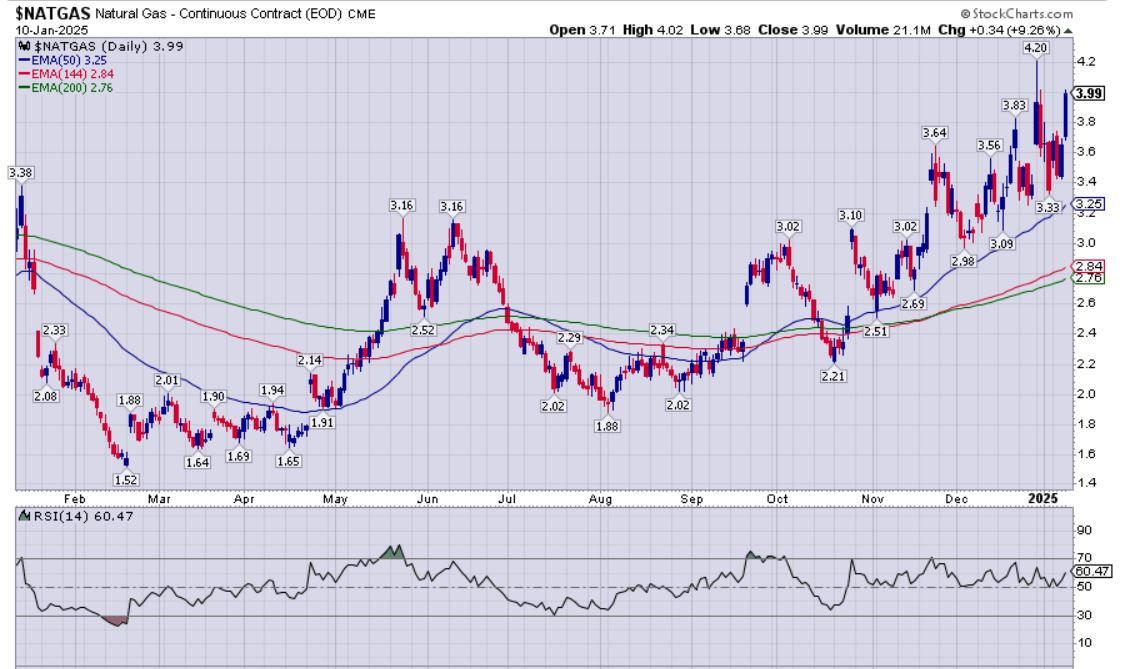
This nat gas chart has been in an uptrend since bottoming last February at $1.52 and it closed this Friday at $3.99, having more than doubled in price over the last year. This is getting the animal spirits going with the commodity investors.
Note the bullish pricing pattern of a series of higher highs and higher lows over the last few months, with pricing staying well above the 50-day EMA.
Hopefully other commodities will start trending more like the pricing action we have seen lately in nat gas, as this is a sector that has been in positive momentum over the last half of 2024.
Thus far in this channel we’ve not delved into the oil and natural gas sectors as much as I would have liked, but here are some US-based natural gas stocks that I feel are worthy of taking a look at, to bring readers here further value.
EQT Corporation (NYSE: EQT) – EQT is the largest producer of natural gas in the US, with operations focused in the cores of the Marcellus and Utica Shales in the Appalachian Basin.
Antero Resources Corporation (NYSE: AR) – an independent natural gas and oil company engaged in the acquisition, development and production of unconventional liquids-rich natural gas properties located in the Appalachian Basin in West Virginia and Ohio.
Range Resources Corporation (NYSE: RRC) - a leading U.S. independent natural gas and NGL producer with operations focused in the Appalachian Basin.
Comstock Resources, Inc. (NYSE: CRK) - a leading independent natural gas producer with operations focused on the development of the Haynesville Shale in North Louisiana and East Texas.
**Wildcard idea: Solaris Energy Infrastructure, Inc. (NYSE: SEI) - this company supports infrastructure and well completion for oil and gas companies, but ALSO has a new energy generation business based on small modular natural gas power plants… with the goal to support AI data centers and other commercial and industrial sectors.
3 Canadian Gassers of choice:
Tourmaline Oil Corp. (TSX: TOU) (OTCPK: TRMLF) - Tourmaline is Canada’s largest natural gas producer focused on long-term growth through an aggressive exploration, development, production and acquisition program in the Western Canadian Sedimentary Basin.
Pine Cliff Energy Ltd. (TSX: PNE) (OTCQX: PIFYF) - A natural gas and crude oil company with most of its assets in Alberta, that has grown to over 25,000 boepd. Pine Cliff has grown so quickly by executing counter-cyclical acquisitions.
Birchcliff Energy Ltd. (TSX: BIR) (OTCPK: BIREF) - intermediate oil and natural gas company based in Calgary, Alberta with operations focused on the Montney/Doig Resource Play in Alberta.
Thanks for reading and may you have prosperity in your trading and in life!
Shad