
Catching Up With the Commodities Complex – Part 1A – Precious Metals
Excelsior Prosperity w/ Shad Marquitz – (05-24-2026)
We are back catching up on the price moves and trends across the commodities complex. There was a bit of content break over the last week and half, because after digging out from attending the Metals Investor Forum earlier in the month, I got swamped getting a number of company interviews completed over at the KE Report in the following week. Then I headed out to attend 2 back-to-back resource conferences in Washington D.C. and then Fort Lauderdale, that just wrapped up before this weekend. But E.P. is back!
My schedule over the last 2 days finally provided a little downtime to decompress and rejuvenate in the sun along the beach here in Fort Lauderdale; while reflecting a bit more on all the keynote presentations, company interviews, and conversations with investors over the last couple weeks. This seems like a good time for a data dump into a brief overview for readers here of Excelsior Prosperity during this long Memorial Day holiday weekend.
There is actually a lot for us to get into, so this will be a 3-part series:
Part 1A will be focused on the precious metals complex,
Part 1B will be focused on energy commodities like copper, uranium, lithium, oil, and nat gas.
Part 1C will be focused on trending critical minerals like rare earths, antimony, and tungsten.
So, let’s get into it…
As we often do, let’s kick things off with gold as the prime mover in the precious metals space. Despite the plethora of market narratives around gold, sometimes it is best to strip out the noise and just look at the actual price action, which takes into account all macroeconomic factors, all geopolitical factors, all investor sentiment, and gets distilled down into all buying and selling on the global stage.
Gold daily chart:
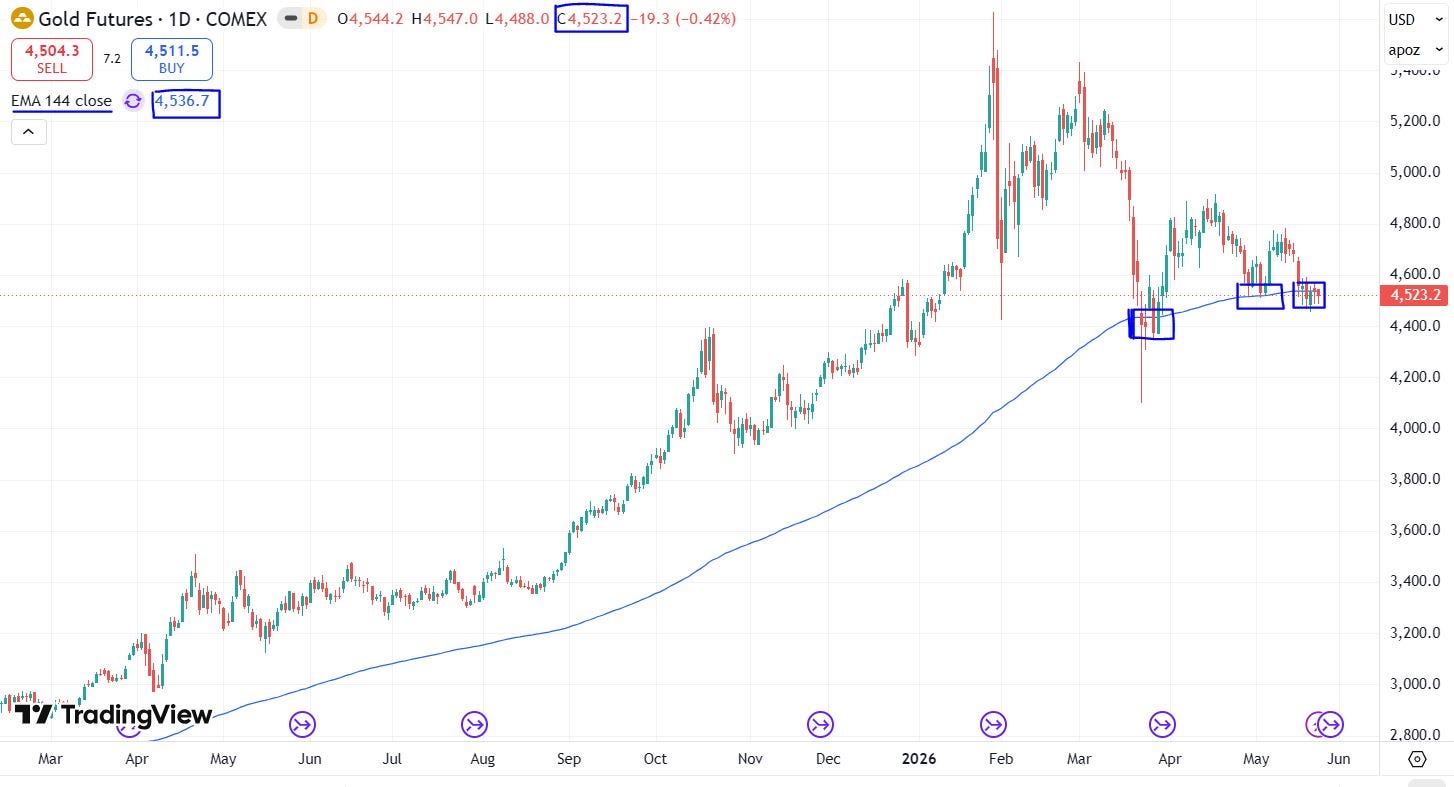
Gold still remains in an overall uptrend, above its 200-day Exponential Moving Average (EMA), after a couple of years breaking out impulsively to new all-time high levels.
Gold futures prices have actually been waffling around either side of the 144-day EMA since March; in 3 clusters of price action (noted in blue boxes drawn on the chart above). This is the common mid-way support between the 50-day and 200-day EMAs.
Yes, there was that one-day test of the 200-day EMA back on March 23rd, but that was an isolated spike low.
Gold pricing has stayed well above that 200-day EMA level for several years now (last breaching it significantly back in October of 2023).
Gold closed last week at $4,523.20, which is still a really respectable level historically, (and a price it had only achieved starting in late December 2025).
One recurring theme around gold at the recent conferences was that many investors let their sentiment get affected by the day-to-day pricing volatility and they see all trends through the lens of recency bias.
The high-water mark in gold was intraday on Thursday January 29th at $5,626.80. Even though that was only for a fleeting moment, many PM investors locked that area in their minds and now they feel like we have been in a meltdown lower ever since then.
There are worries that moment was the top in the precious metals sector, and while we can’t rule that out as possible, it just doesn’t seem probable that January spike high was “The Top.”
As discussed in the prior articles, Gold is still well above its 50-week EMA (currently at $4,265), which is a more important level to stay above.
Even if that level were to be breached, Gold is still also way above the 200-week Exponential Moving Average (currently way down at $3,074). Now, if that level gets lost, then sure, we may have to retool the parameters for this PM bull market.
For now, pullbacks to key support levels like the 200-day EMA and 50-week EMA should continue to be accumulated, in anticipation of the next leg of the larger bull market that is still unfolding.
Let’s now shift over to the price action in the gold stocks. We’ll kick things off with a daily chart of the big boy gold miners held inside of the VanEck Gold Miners ETF (GDX).
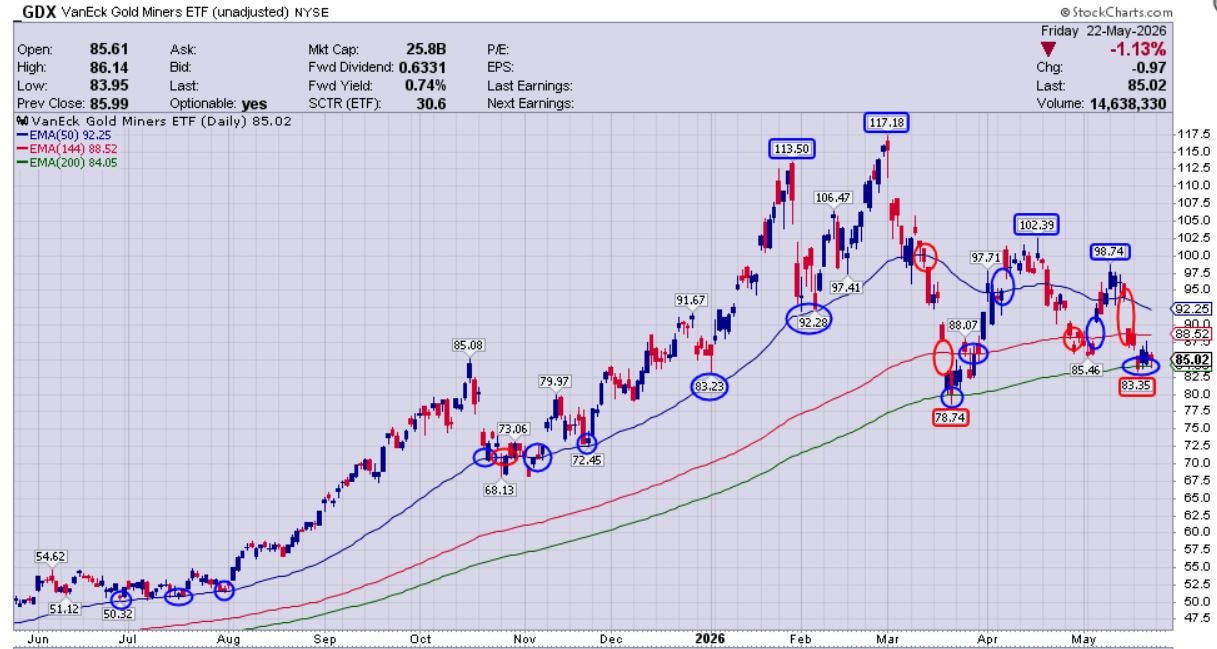
(GDX) pricing was respecting the 50-day EMA all last year and into the early part of this year, but then that support level broke during the extreme selling pressure in March.
In March, (GDX) dropped down through the 50-day and 144-day EMAs, and found support at the 200-day EMA.
It bounced from there and got back up above the 144-day and 50-day EMAs during the April rally; but then the rally ran out steam, and pricing dropped back down to the 144-day EMA support again in late April to early May.
We wrote in the last article about the “Spring Fling” rally in early May that took (GDX) pricing back up above the 50-day EMA again, but then that move ran out of energy and rolled back over hard the last week and a half.
For the last 5 trading sessions of last week (GDX) was back down testing the 200-day EMA. Gold mining bulls will want to see that level hold in the week(s) to come.
VanEck Junior Gold Miners ETF (GDXJ) - daily chart:
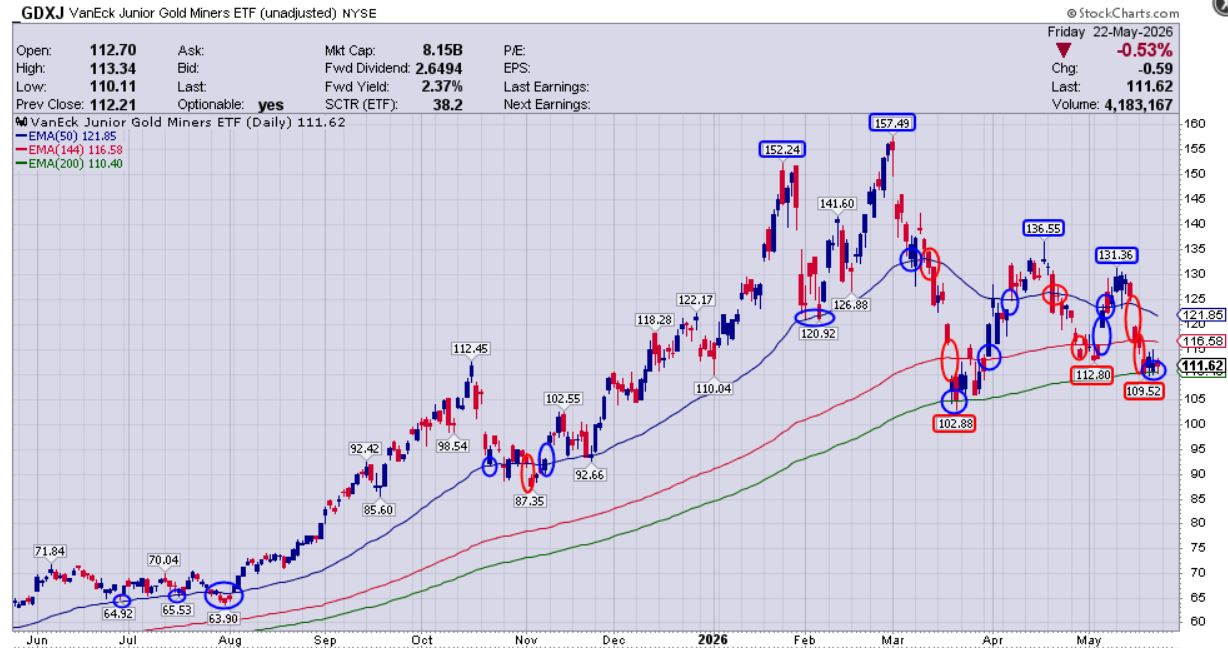
The (GDXJ) chart is quite similar to (GDX), so kind of a mirror-match on they key takeaways.
This makes sense though – Despite the name containing the word “Junior” it really is mostly a basket of mid-tier gold producers, and much larger market cap companies than the junior gold stocks many investors are holding in their portfolios.
(GDXJ) pricing was respecting the 50-day EMA all last year and into the early part of this year, but then that support level broke during the extreme selling pressure in March.
In March, (GDXJ) dropped down through the 50-day and 144-day EMAs, and found support at the 200-day EMA.
(GDXJ) bounced from there and got back up above the 144-day and 50-day EMAs during the April rally; but then the rally ran out steam, and pricing dropped back down to the 144-day EMA support again in late April to early May.
We wrote in the last article about the “Spring Fling” rally in early May that took (GDXJ) pricing back up above the 50-day EMA again, but then that move ran out of energy and rolled back over hard the last week and a half.
For the last 5 trading sessions of last week (GDXJ) was back down testing the 200-day EMA. Gold mining bulls will want to see that level hold in the week(s) to come.
Global X Gold Explorers ETF (GOEX) – daily chart:
There is no good “Junior” ETF, and investors really must #BuildYourOwnETF.
Despite its misleading name of “gold explorers” (GOEX) is actually filled to the brim with mid-tier gold and silver producers; but it does have a few of the largest market cap quality junior gold stocks peppered within its lower-weighted holdings.
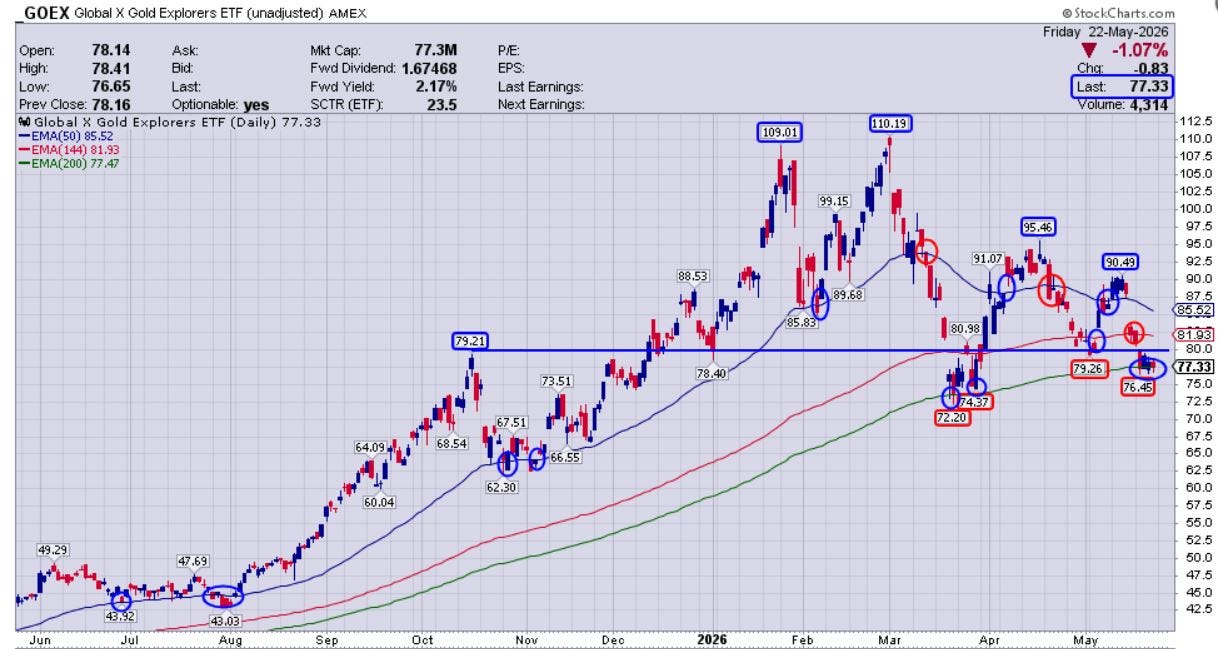
(GOEX) has the same basic pattern that both (GDX) and (GDXJ) have, where it was respecting the 50-day EMA all last year and into the early part of this year, but then that support level broke during the extreme selling pressure in March.
In March, (GOEX) dropped down through the 50-day and 144-day EMAs in a bearish move, (even breaking below the lateral price support from the prior October peak at $79.21), but did find support at the 200-day EMA.
Since then it has been choppy trading throughout March/April/May, waffling back and forth between the 200-day EMA and 50-day EMA, and occasionally getting hung up at the 144-day EMA as a midway stopping point.
Just like the other gold producer ETFs, (GOEX) spent the last 5 trading sessions of last week (GDXJ) was back down testing the 200-day EMA. Gold mining bulls will want to see that level hold in the week(s) to come.
Let’s shift to Silver, with a somewhat different pricing pattern.
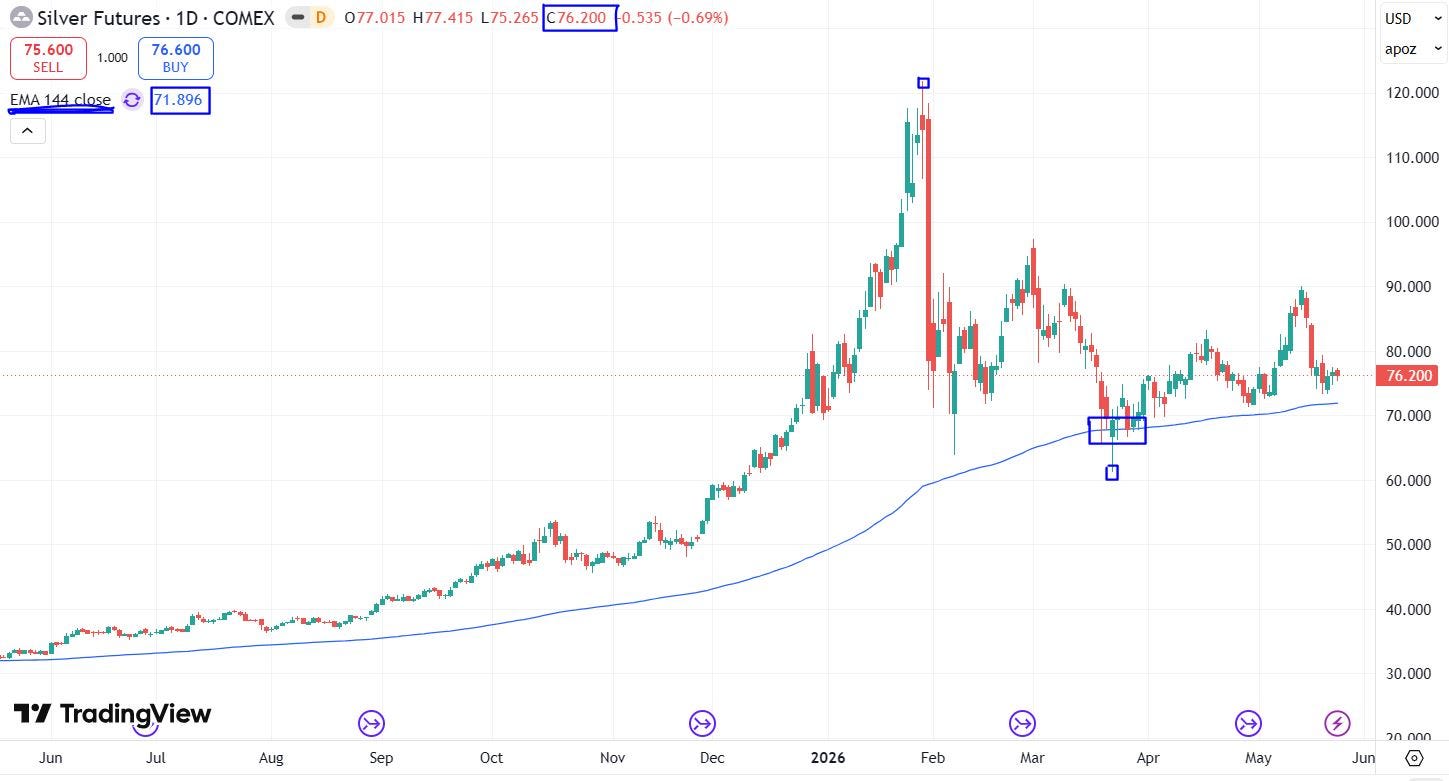
Despite its extreme volatility, Silver really only tested the 144-day EMA support during the late March timeframe, and has actually held above this level for both April and May.
In that sense, Silver has held up better technically since the March than gold has.
Having said that, Silver nearly got chopped in half in just a one day on January 30th, whereas Gold didn’t correct anywhere near as much on a percentage basis.
Silver volatility is always more extreme than gold, but this really has been an insanely wide $60 price range between the high of $121.78 from January 29th to the low of $61.21 on March 3rd.
Most people reading this likely remember when the silver price was stuck between $17-$35 for a number of years leading up this recent rally. Now this latest volatility range is about twice as much as the highest price levels that silver had achieved in a decade and a half.
Overall, the silver stocks mirrored these same differences compared to the gold stocks, where pullbacks were more on a percentage basis, but then mostly held above the 144-day EMA versus retesting the 200-day EMA again for the second time over the last week, like the gold stocks did.
Having said that… We’ve highlighted in prior articles here that some of the higher-torque silver producers like Avino, Santacruz, Americas Gold and Silver, Silver X, and Guanajuato Silver, essentially got chopped in half during the crash from late February to late March, whereas most of the gold producers were down much less.
In contrast to the highest torque silver equities, the silver stock ETFs actually held up better as a collective group, (likely because some of the seniors also have heavy contributions from gold production along with the silver output, and there are some straight-up gold producers and gold royalty companies inside this ETF).
As a result, the “Silver” stock ETFs pulled back less on a technical strength basis, when looking at where their moving average support came in.
Global X Silver Miners ETF (SIL) – daily chart:
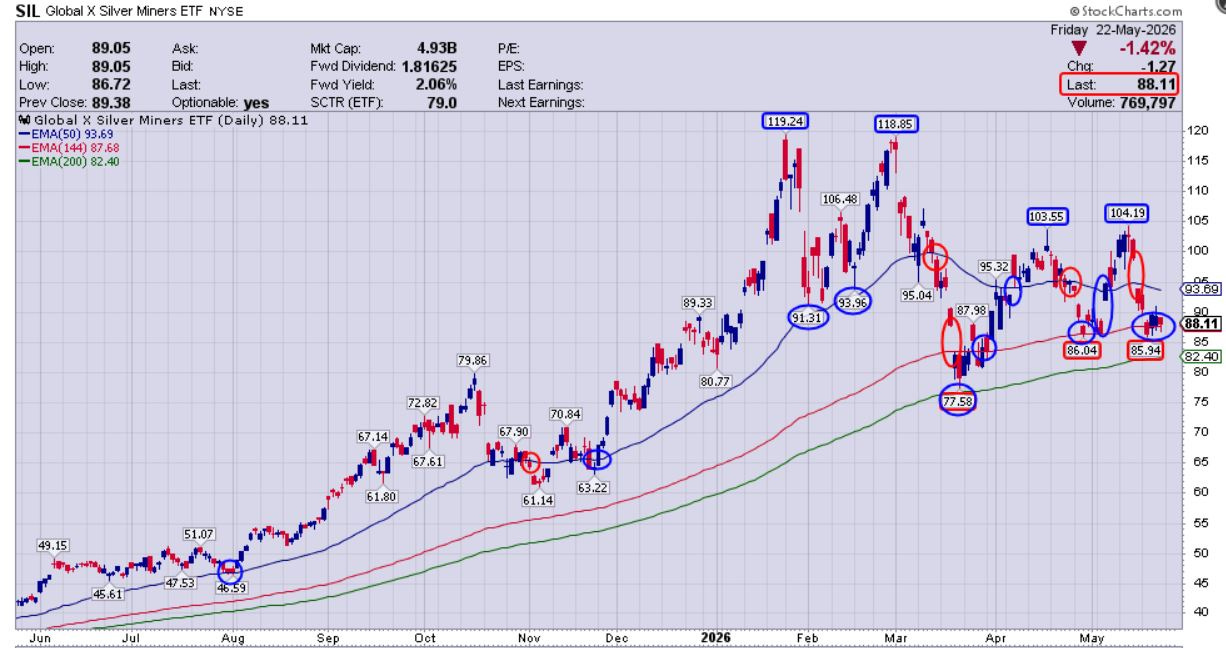
(SIL) did come down crashing down in March to very briefly tag the 200-day EMA for just 1 day, but really the 144-day EMA was the battleground where support came in for this ETF; and that is the level that has been retested two more times during both the April and May drops.
It would be nice to see the 144-day EMA continue to hold, without having to retest the 200-day, as that would be the more bullish outcome, and would indicate that silver stocks are leading the charge back higher again.
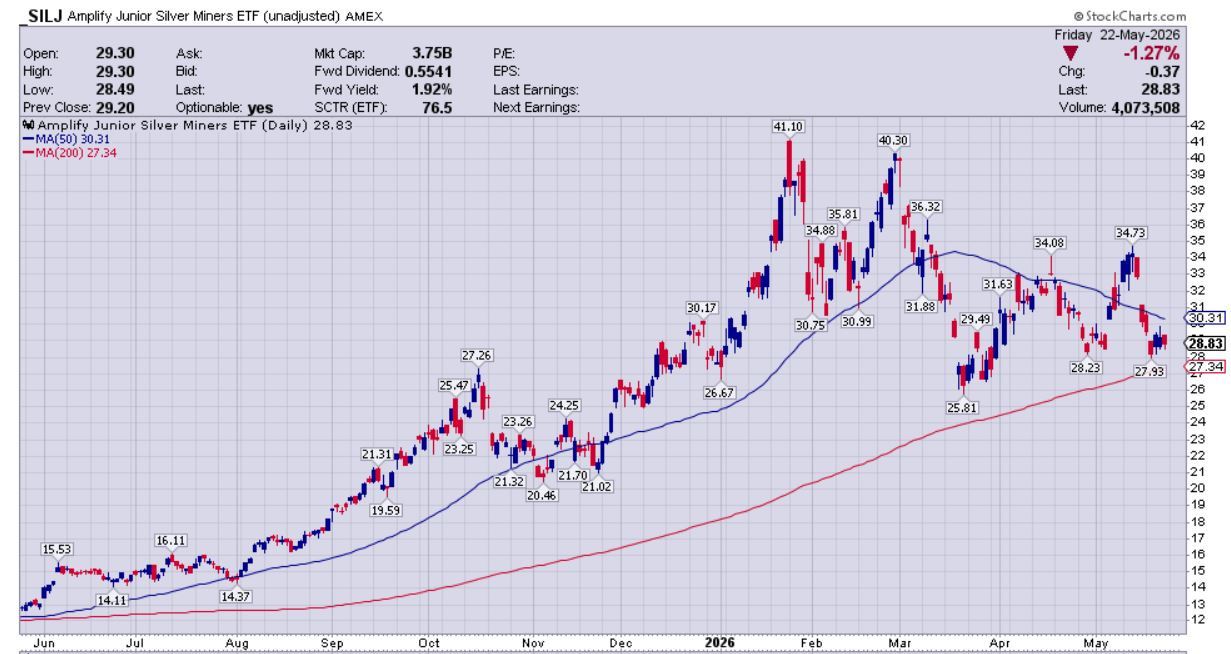
Amplify Junior Silver Miners ETF (SILJ) – daily chart:
This ETF has the most unusual makeup of any of the ETFs – the heaviest weighting positions are senior silver producers, then the middle of the ETF is dominated by mid-tier to smaller gold producers and even some large gold developers, and then the very lightest weighted positions are true silver junior developers.
Again, despite its name it is definitely NOT representative of silver juniors, but it does hold an interesting place in the PM space.
Of all the ETFs…. I can see why some investors hold this one as an internally hedged basket of silver and gold stocks.
Again, I encourage investors to pull up the holdings of these ETFs and assess whether there are any individual names that they’d like to do due diligence on and add to their portfolios.
The other important consideration is for PM stock investors to ascertain if the individual stocks in their portfolio may actually be trading more in tandem with ETF inflows, versus strictly on the fundamentals of their respective news. Sometimes the passive investing flows swamp the individual company specifics, and may explain chart moves more that are happening on days where there is no substantive newsflow.
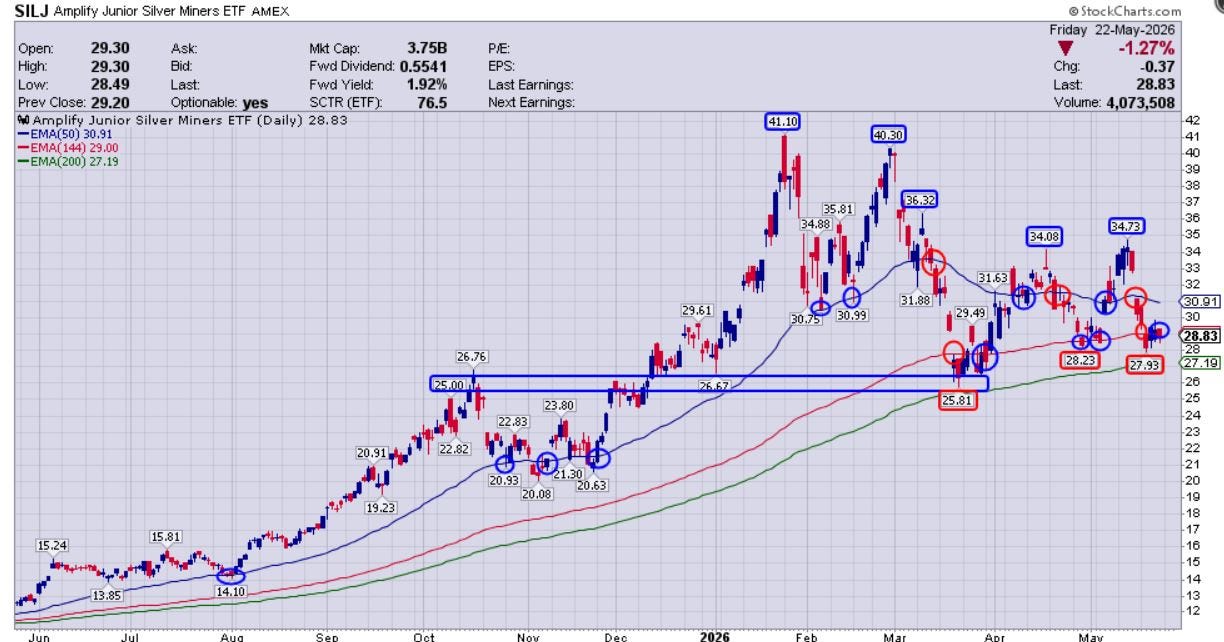
(SILJ) ever-so-briefly flirted with the 200-day EMA, but just for a day, and it actually never got there. Instead, it bottomed right in the heart of a lateral pricing support zone, formed from October and December 2025 price peaks and troughs (as noted by the blue rectangle).
Similar to (SIL) the pricing in (SILJ) really has duked it out at the 144-day EMA support level; which is not a surprise to those of us that follow Fibonacci numbers.
This is a good place to illustrate the point on why we use the EMAs and also why we include the Fibonacci number 144 as an EMA for the daily or weekly charts.
The Exponential Moving Average (EMA) is more sensitive to recent price changes compared to the Simple Moving Average (SMA).
SMA assigns equal weight to all data points, which may cause it to lag behind current trends.
EMA uses a multiplier to apply greater weight to recent prices, making it more responsive to the latest data.
Many technicians that only use the far more widely utilized 50-day Simple Moving Average (SMA) and 200-day SMA are still scratching their heads trying to discern what the pattern is.
Here is the chart that they see, and so most of them are saying that there is no discernable pattern… however, that is because they are flying the plane but using the wrong instrumentation dials.
Speaking of silver stocks…
Here’s a throwback to the Metals Investor Forum (MIF) held earlier this month in Vancouver, Canada.
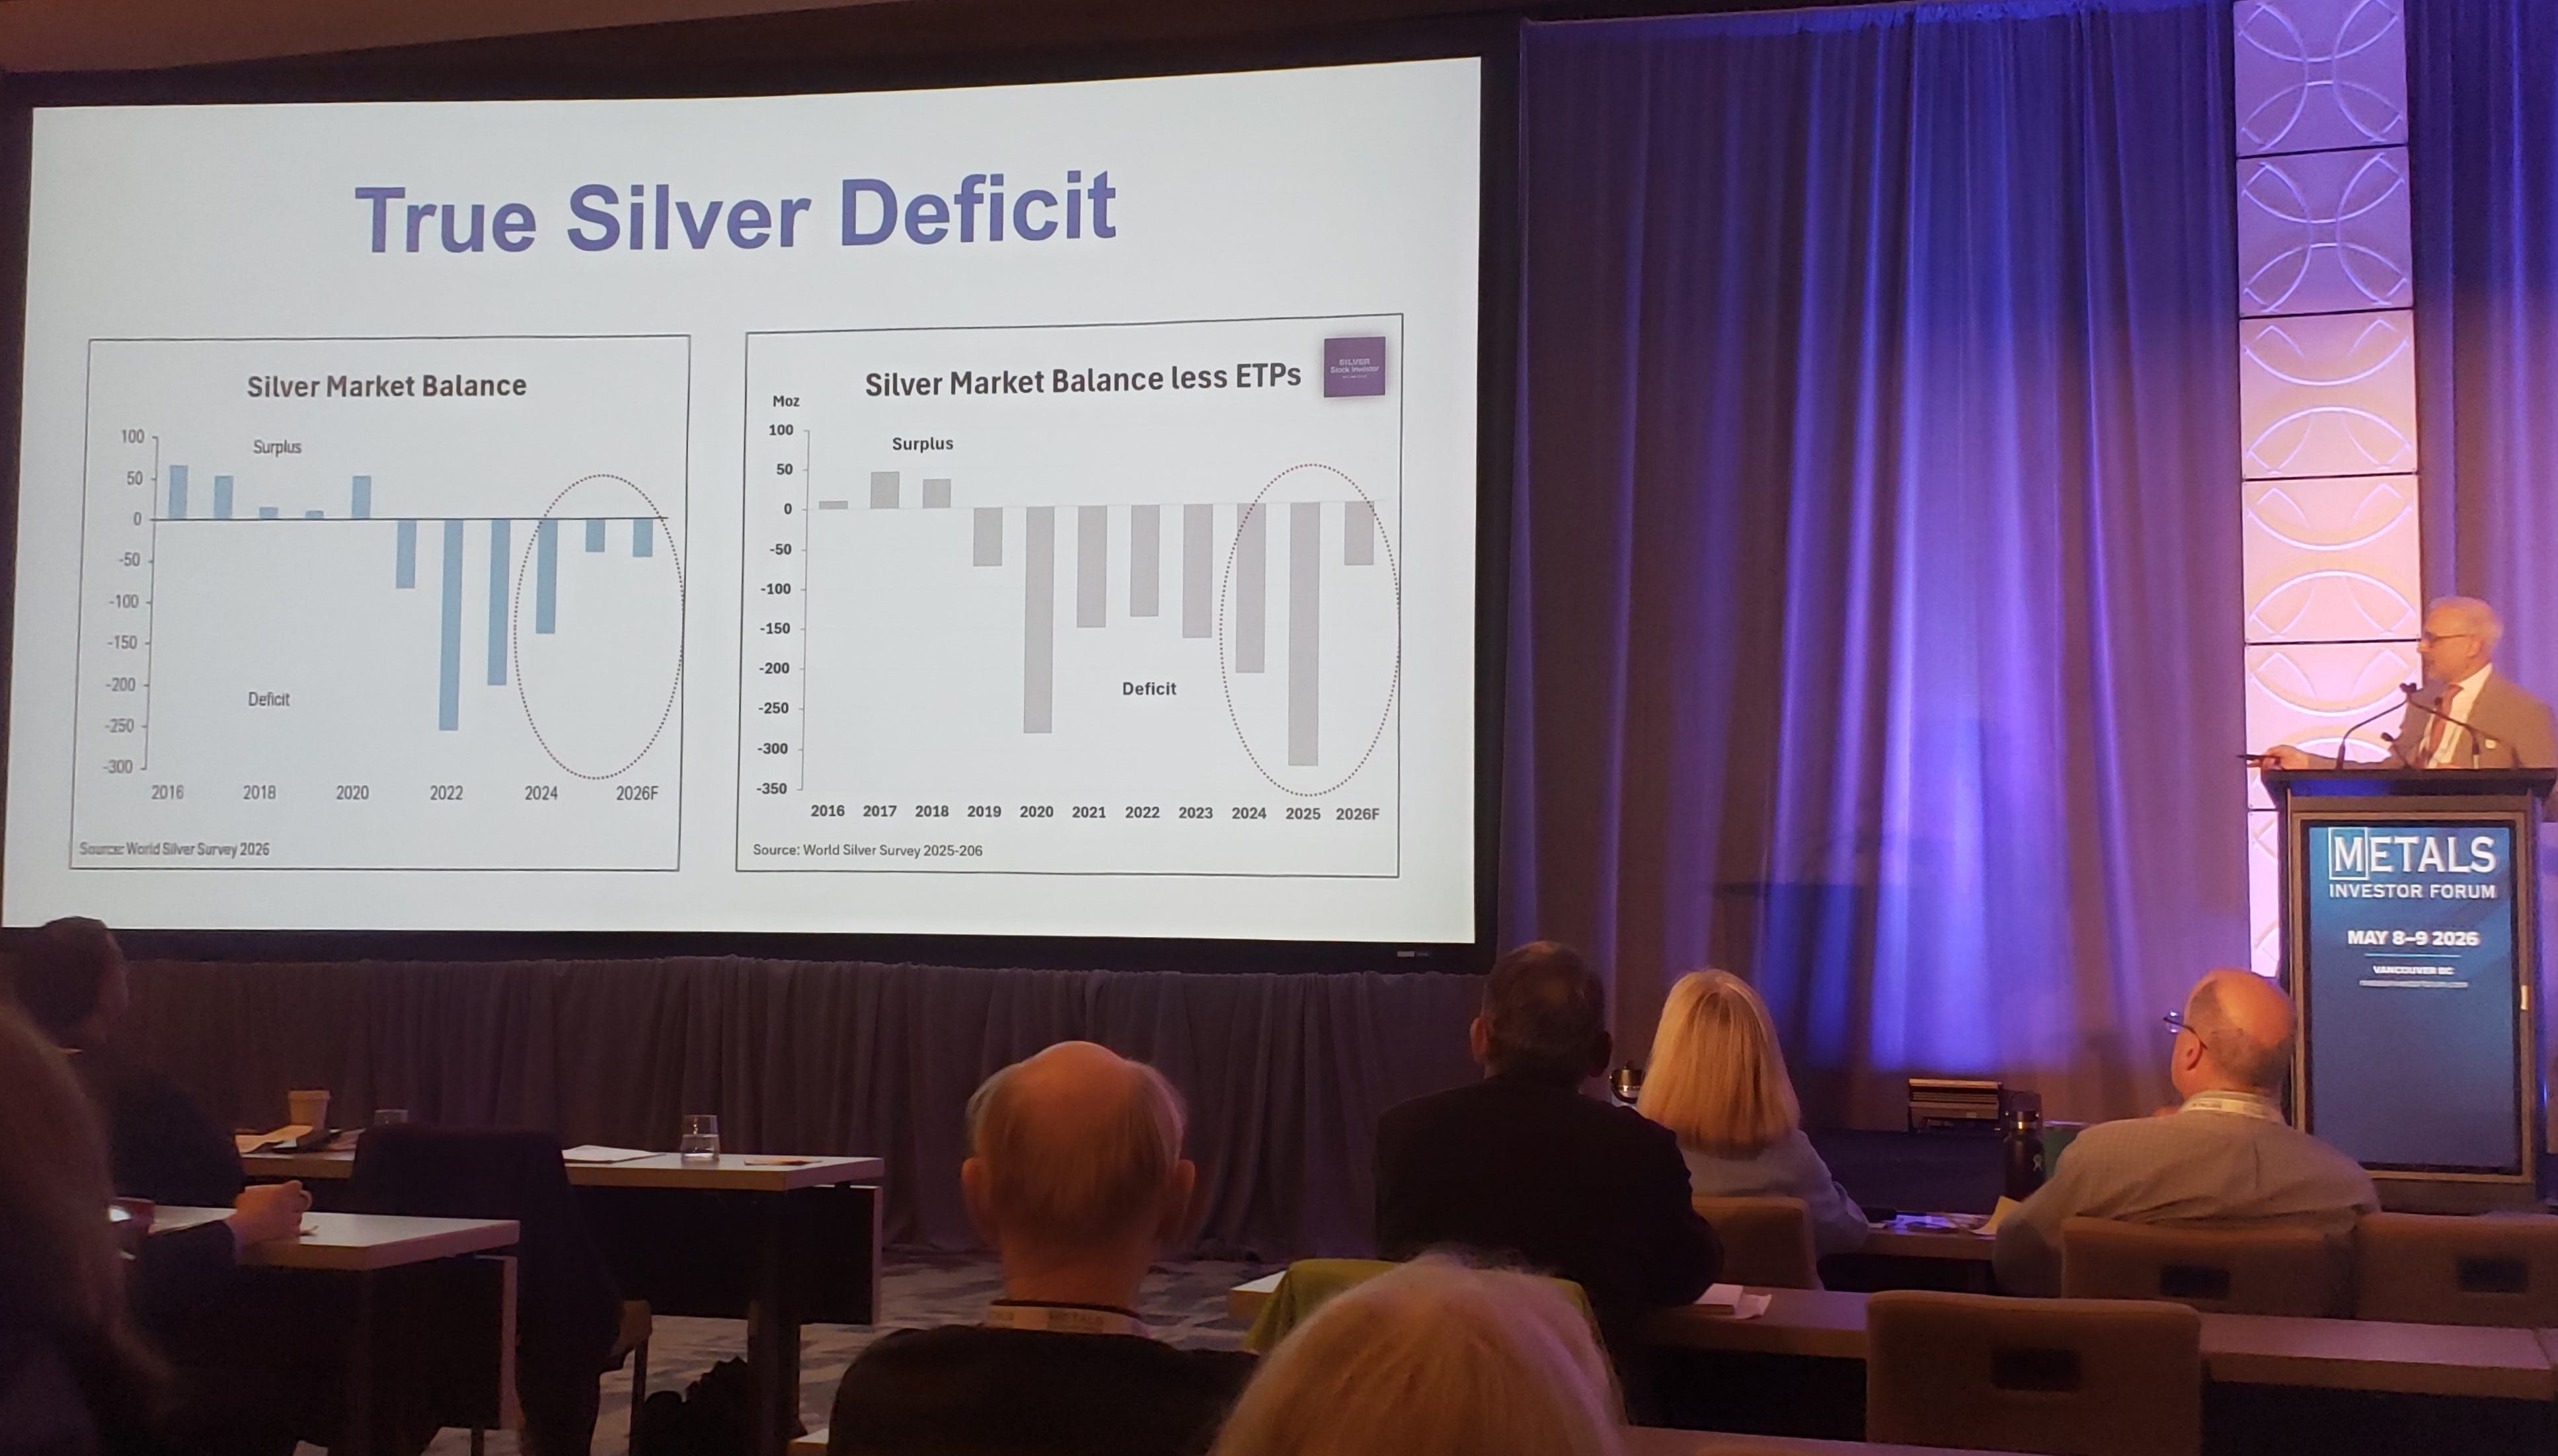
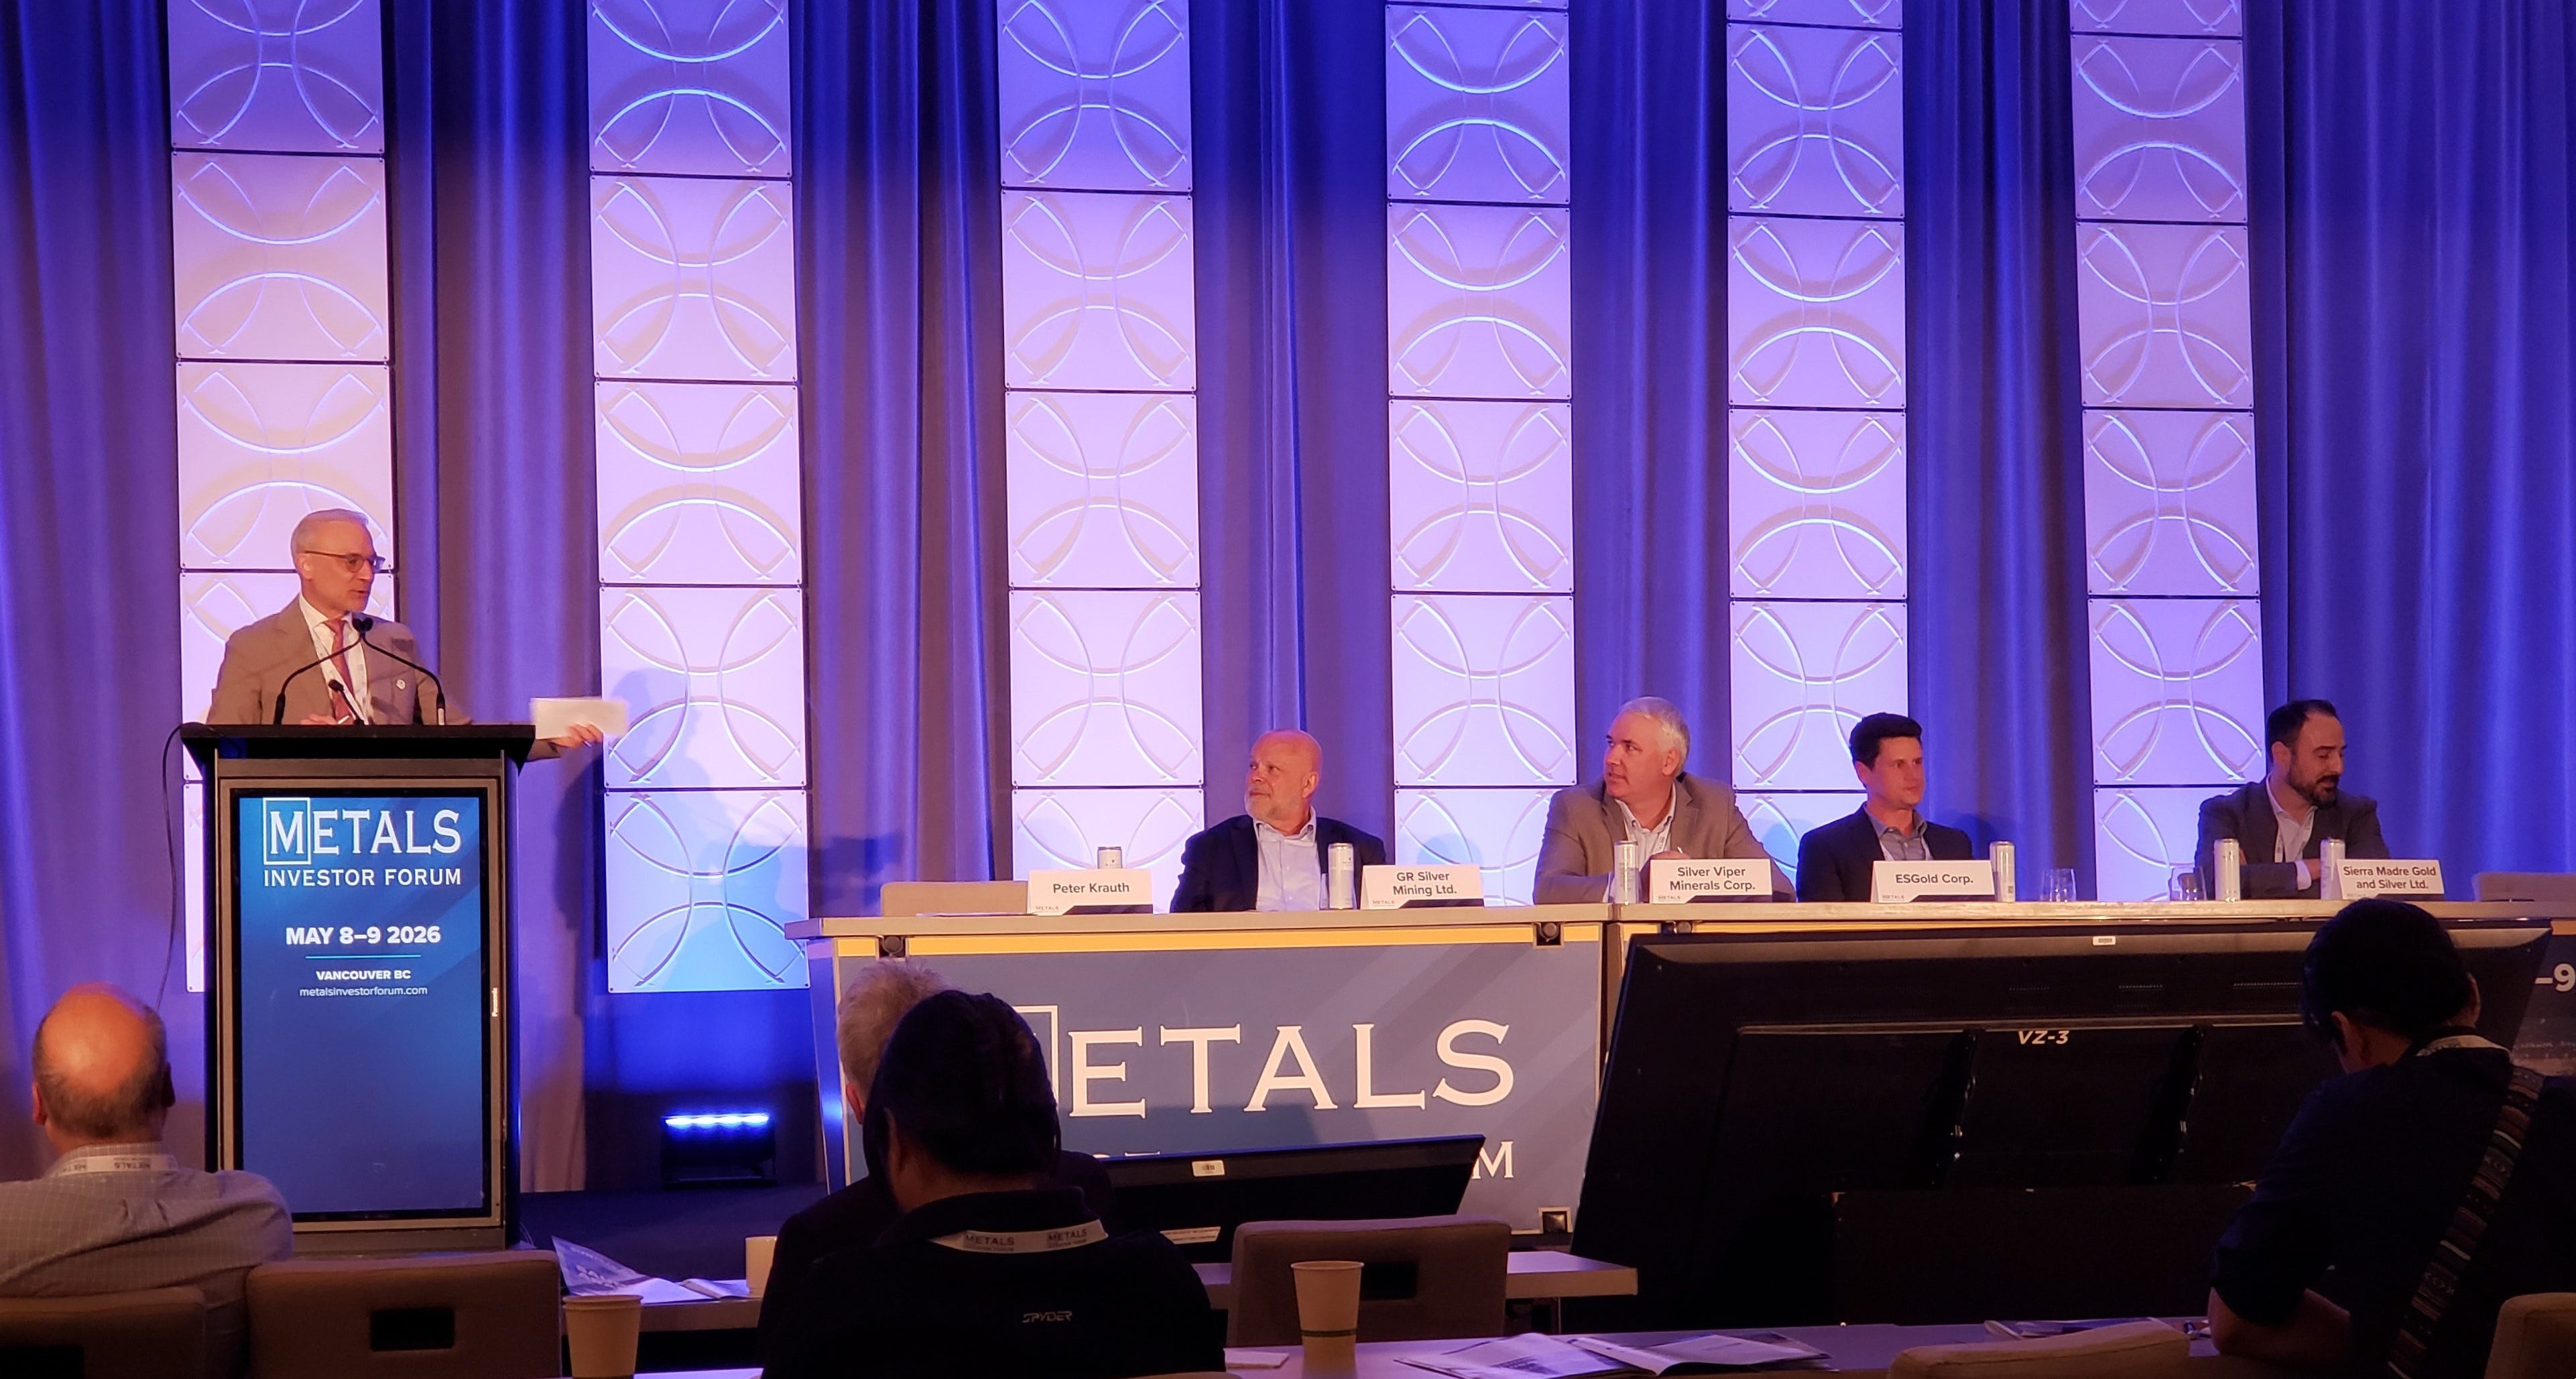
One of the highlights for me each time, as a silver-mining bug, is Peter Krauth’s keynote presentation on silver and his panel with silver mining stocks.
This time Peter featured the following companies on his silver panel.
GR Silver, ES Gold, Silver Viper, and Sierra Madre Gold and Silver
As readers of this channel know, a big focus that has been discussed for outperformance over the last couple years has been growth-oriented precious metals producers.
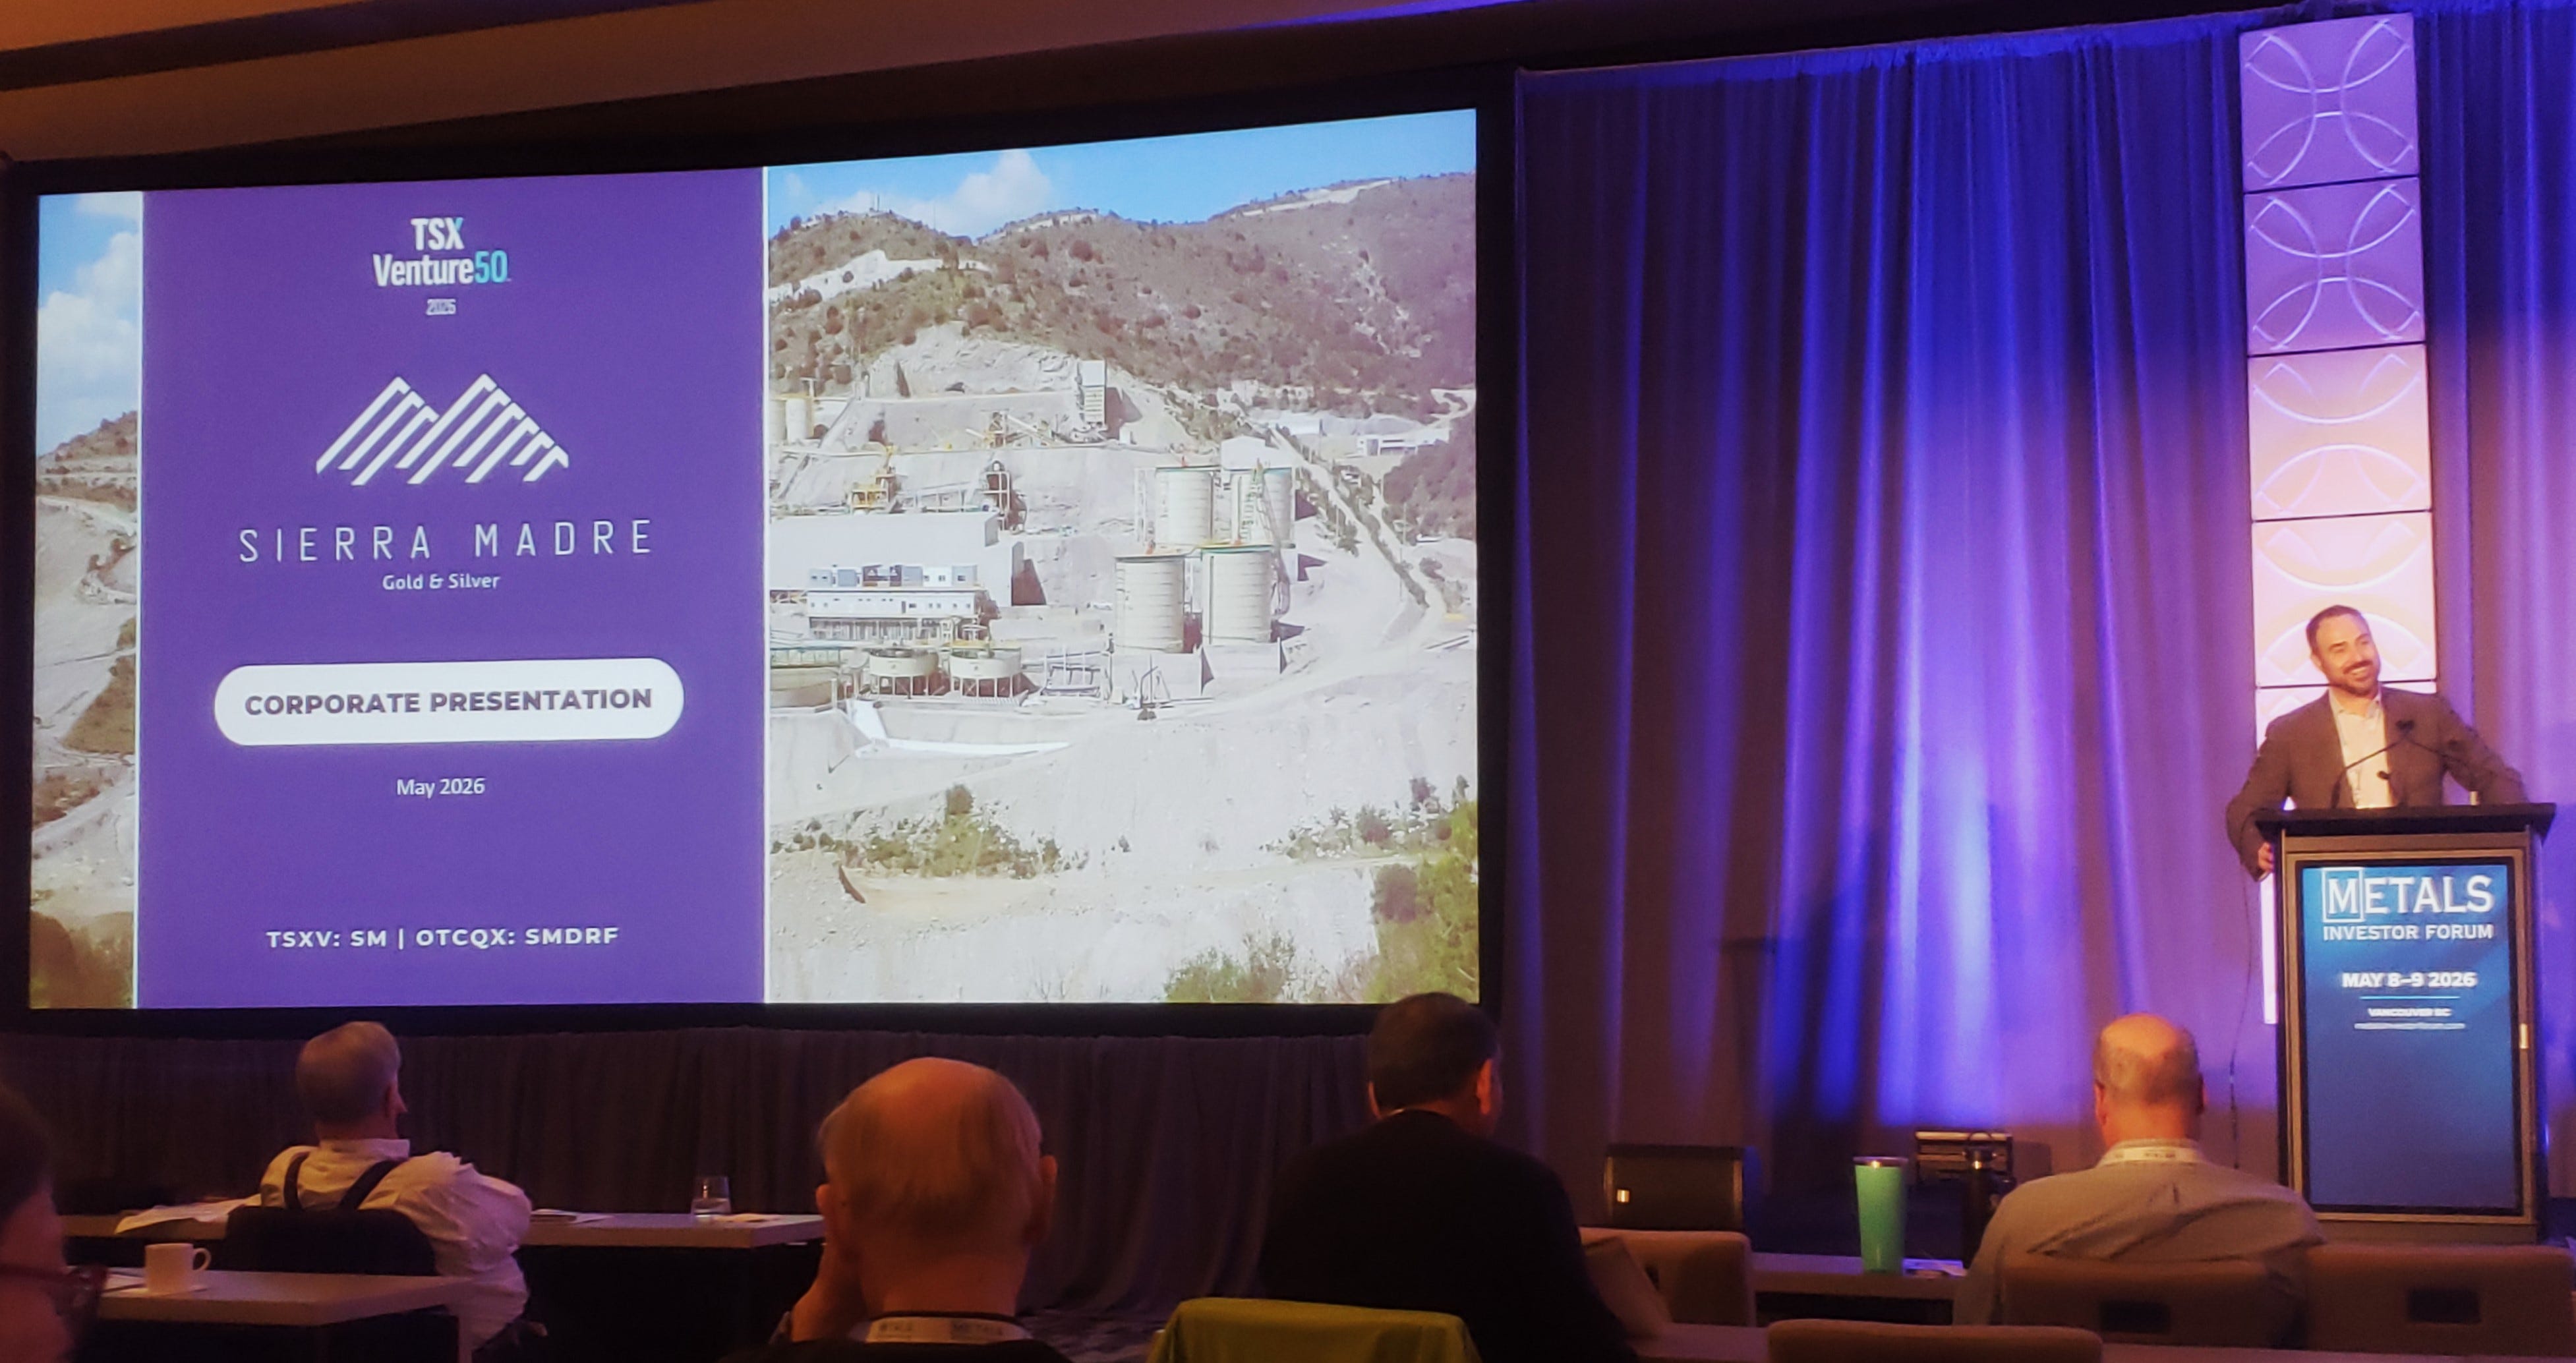
Sierra Madre is a significant portfolio position, and they are also sponsors of the KE Report, so I’m biased in those regards; but their propensity to outperform their guided milestones the last couple years is refreshing, and the speed in which they’ve gotten 3 silver mines in Mexico back into production is impressive.
Layering onto that operational backdrop, they also just closed an acquisition on 3 more silver mines from First Majestic.
This profile gives them the runway to really become a solid Mid-tier producer over the next 2+ years. This company is still a junior producer today, so they have an interesting journey in front of them to potentially rerate, providing Alex and the team keep executing on their vision.
As a final MIF takeaway, and general reflection on the markets, from the Precious Metals to Base Metals, to Critical Minerals, this discussion with my partner and Co-host, Cory Fleck, over at the KE Report does a good job of summarizing my general outlook on the metals space, and will set up the next 2 parts of this series.
KER Market QuickTake: We share insights on the resource sector, noting a muted sentiment at the recent Metals Investor Forum in Vancouver compared to earlier in the year. We discuss key technical levels for gold, silver, GDX, the breakout in copper prices and outperforming copper stocks, lithium, rare earths, antimony and tungsten stocks, while also analyzing the significance of major M&A activity (Equinox Gold bid for Orla Mining and Elemental Royalty buying Vizsla Royalty).
Thanks for reading and may you have prosperity in your trading and in life!
Shad