

Uranium Sector Update – Is There A Leak In The Cup?
Uranium Sector Update – Is There A Leak In The Cup?
Excelsior Prosperity w/ Shad Marquitz – (07/03/2024)

In this uranium market update, we are going to cover a lot of ground; including the technical setup in the uranium stocks, portfolio changes made over the last month during this continued corrective move, exclusive individual company interviews (including in a new uranium portfolio position), and fundamental updates on uranium and the larger nuclear fuel cycle in other embedded curated interviews.
A little over a month ago I did a uranium market update with an article titled "My Cup Runneth Over,” which was a reference to the “Cup & Handle” bullish chart pattern that many technicians were pointing out with URA and URNM. The probabilities were more favorable for a resolution to the upside out of those types of technical patterns, and so my inclination was to start buying uranium stocks into that pullback. I was using funds last month that I had moved to the sidelines after pulling profits on 20%-30% of my overall uranium positions in late January through early February this year, when sentiment just felt uber-frothy in the sector. By late May it felt like sentiment was conversely getting a bit too washed out, and that technically the uranium stocks looked poised to move higher after working on the handle consolidation part of the cup-and-handle pattern.
Additionally, that article included a few other exclusive interviews we did over at the KE Report with Director of Stocks at Simpler Trading, TG Watkins, Uranium Insider, Justin Huhn, publisher of Wealth Megatrends, Sean Brodrick, and the co-owner of Digest Publishing, Nick Hodge. They were also uniformly bullish for the near-term to medium-term (just like I was), thinking most of the consolidation of the prior big rip had played through. I should also add that they are all very smart technicians, traders, and fundamental market observers of resource stocks. Either we all got fooled and the space is heading for an even larger and longer corrective move lower, or maybe we were just a month early and this consolidation and handle formation has s simply dragged on longer that most were expecting.
Well, as most investors following the uranium stocks know all too well… the sector has continued to weaken and further correct during the month of June. Some folks could argue that the cup & handle patterns in the ETFs (URA) and (URNM) could very well still be in play for an eventual resolution higher, and that we just consolidated for another month. However, another group of technicians looking at the charts could make the case that the cup and handle patterns have now broken down, where the handles have become too extended or pulled back too far for the pattern to still be valid. I can understand both lines of thinking, and we’ll dig into that debate in the charts below, and look at both the bull case and bear case. This is why I titled this article, “Is There A Leak In The Cup?” as a tongue-in-cheek callback to the prior article, and pondering if the cup-and-handle patterns have broken down.
Just as an aside: In these articles, my goal is to be transparent, consistent, and keep it real; because the whole point is to reflect on good investment ideas in the sector and discuss both good and bad trades. So, if my read on the technical or fundamental situation breaks down or changes, then it’s important to share that with folks here in this channel, and there are times when my outlook is just going to be flat out wrong. It regularly happens to us all when investing, and position-trading is not easy, and nobody bats 1000%.
This may be one of those times where my more bullish outlook doesn’t pan out as planned in the uranium mining stocks for the near to medium-term. Having said that, at this point the uranium miners look like they are at an inflection point, where there still isn’t a clear resolution of direction yet. On the bullish side URA and URNM may still may resolve to the upside and break out of a protracted C&H pattern, or on the bearish they may just break down further and pick up even more downside momentum. We’ll look at the charts for where we are in the here and now, and analyze the cases for the breakout or the breakdown. The uranium miners are at the point where they need to pick the trend and overall direction for a bigger extended move; but it is important to also note that markets often do one last head fake to get the maximum amount of traders off-sides, right before suddenly changing direction in a big way.
Let’s have a look at the URNM chart to see about this potential cup & handle pattern:

Sure, I guess one could say in the URNM cup & handle pattern that the recent low of this consolidation at $48.69 has been above the recent low at $48.19 and well above the low of the cup at $44.91. However, that is a really long handle, and most wouldn’t have expected it to have extended so low and for so long, so it is possible that the pattern has broken down. We’ll know in the next few weeks and months to come, if we get a bounce here off the 200-day moving average that sends this pattern resolving positively to the upside, or if current support breaks setting up a bigger downside correction.
Now, let’s remove the cup and handle pattern and just look at how pricing has interacted with the 50-day, 144-day, and 200-day exponential moving averages (EMAs) as support.
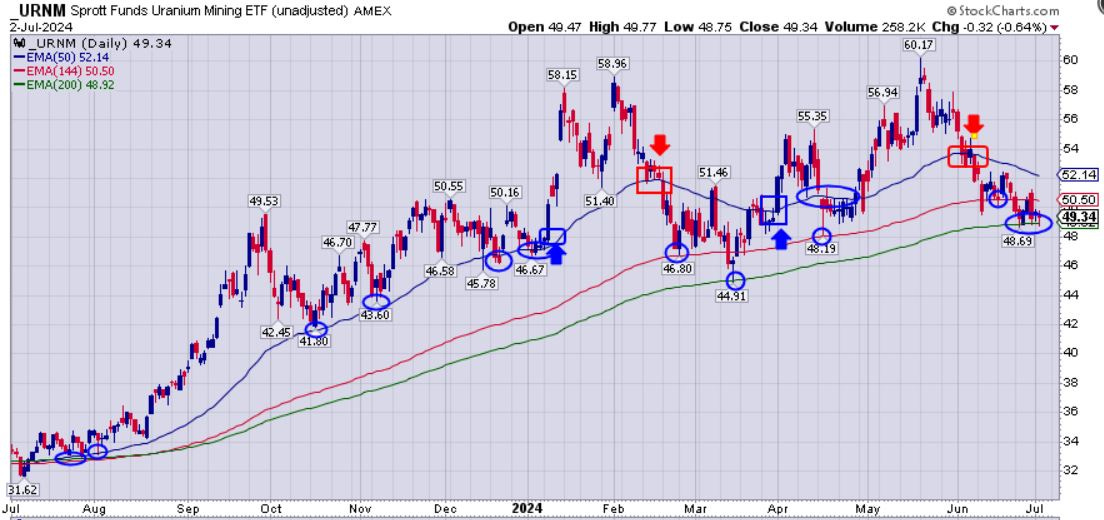
We can note that for a long time, the pricing on the (URNM) chart of the uranium miners was respecting the 50-day EMA, the latter half of 2023, and the first few months of 2024, where it crossed bullishly up through it, and had the nice surge [first blue box] into a mid-January and early February surge. Then in February pricing consolidated near the 50-day EMA, but ultimately broke lower [first red box] going down and bouncing off the 144-day EMA, and then finally testing and bouncing off the 200-day EMA in mid-March.
This started a new uptrend in late March/early April [next blue box], and we saw the 50-day EMA come back into support through April (after a very brief initial dip to retest the 144-day EMA). Pricing blasted higher off support in late April and up higher into mid-May, where pricing put in a new intermediate peak of $60.17. Since that high-water mark, pricing has consolidated lower in mid-May, June, and to kick of July. There was initially some support at the 50-day and 144-day EMAs, but ultimately it has been the 200-day EMA getting tested over the last 2 weeks. This seems like a good place to layer on more uranium positions, for the potential bounce. However, if this 200-day EMA gives way after this consolidation (similar to what we saw at the 50-day and 144-day EMAs when they gave way) then we’d be in bigger technical trouble. So it’s make it or break it time in this URNM ETF.
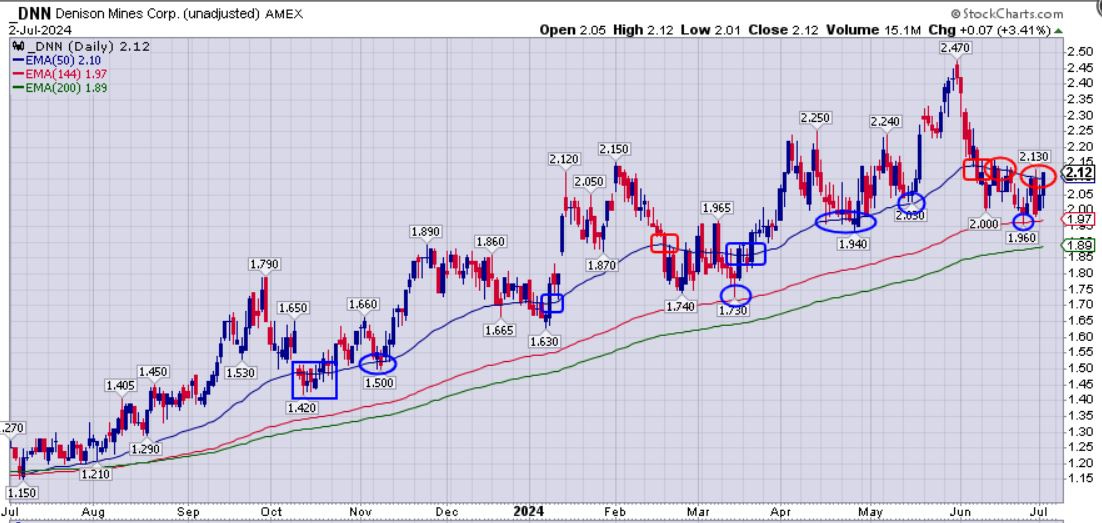
If we look at some charts of some popular uranium stocks, we can see similar tests of the key Exponential Moving Averages.
Looking at the daily chart for Denison Mines (DNN), we can see that the 50-day EMA was key support since last summer, but that in March and June the 144-day EMA got tested, held, and bounced. It is holding up better than some of it’s peers.
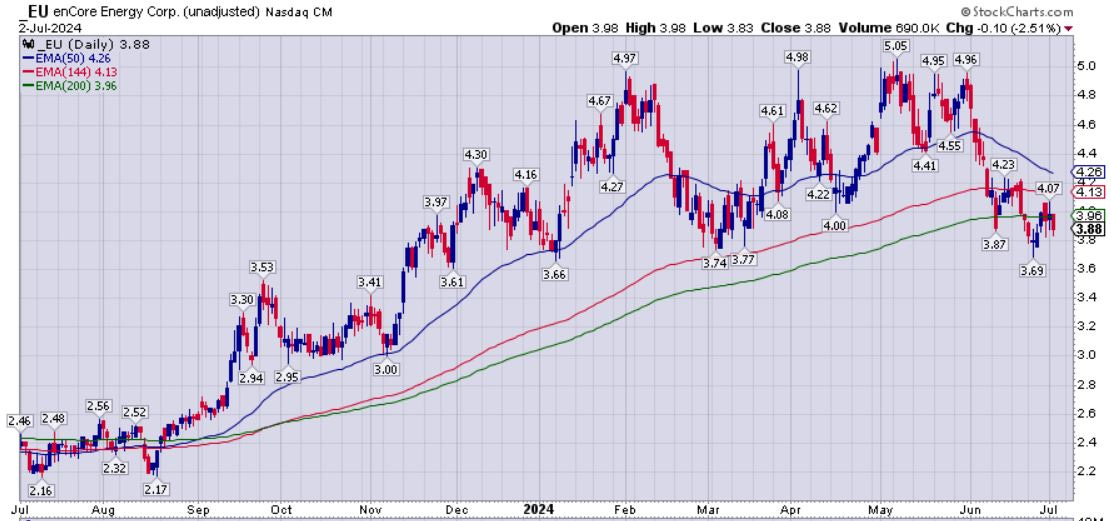
With regards to the enCore Energy (EU) chart below, it has already broken down below even the 200-day EMA and if there was a cup & handle pattern in place, then it has surely broken down at this point; (having made a lower low at $3.69 than the low of the cup at $3.74/$3.77). This chart has a bearish posture at this point, and the 50-day EMA is sloping down towards the 144-day and 200-day EMAs, which is not the direction bulls want to see that trend developing. I’m still tempted to add more to my position here near the 200-day EMA, but with pricing having broken below it, I want to see a strong thrust above it to gain more conviction, because otherwise it could just keep heading lower and correcting further (meaning better entries at even lower prices for waiting it out). Again, many of these charts are right at an inflection point.
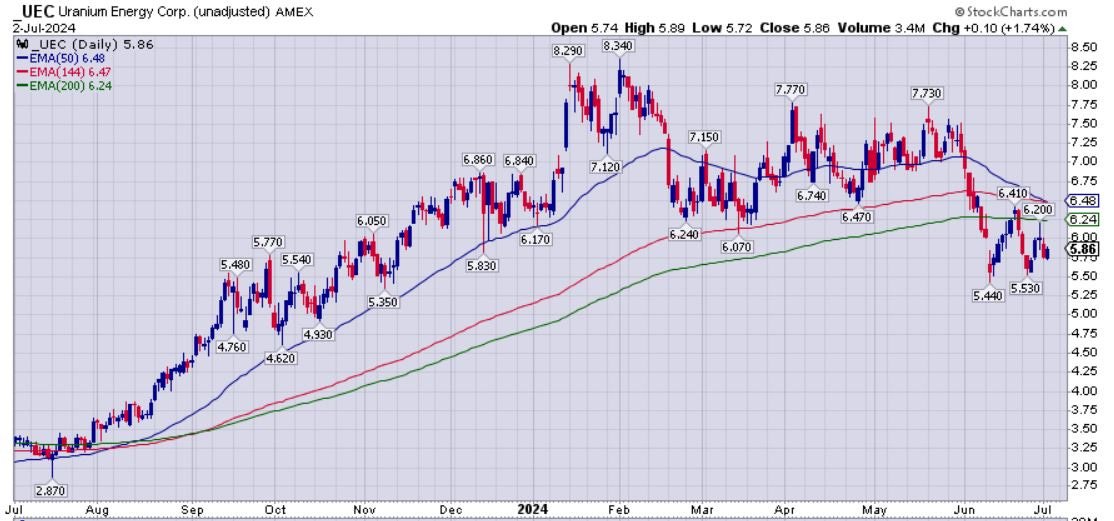
Then with Uranium Energy Corp (UEC), it has a bearish looking chart like enCore does. UEC has clearly broken below all 3 levels of EMA support, and is down in a more bearish posture below the 200-day EMA. Also the 50-day EMA has now sloped downwards to meet the 144-day EMA, and looks like it may cross below it any day now, which is also bearish technical action. Even though the technical breakdown is concerning, I did add some UEC last week at $5.64 (more on that shortly)…
So as an overall takeaway, URNM, Denison, enCore, and Uranium Energy Corp all have charts where pricing is either testing lower support levels, or that has broken down below key EMA support in bearish postures. As a result, pricing could keep correcting down lower, and so bulls will want to see pricing rally back up above 200-day and 144-day EMAs to get into a more constructive technical setup. It’s been tough sledding in the uranium mining stocks over the last 6 weeks.
I’m going to now repost a few paragraphs from last month’s uranium market update, to be clear on what I said, the way I was looking at the technical setup, and the actions I was taking in my own portfolio by starting to add to new exploration positions. The sections that get bolded are going to be slightly adjusted just to emphasize passages that are more germane in our present setup, after having pulled back down further in the handles of the chart patterns over the last month.
“Even if the peak in URA from February at $58.96 connects all the way over to the recent peak at $60.17 to form an even larger cup, and even if we still correct down for a month or two to make a consolidation handle on a larger cup, it still is going to have the disposition to break out in a bullish fashion, after the consolidation period of the handle has completed. So, even in a short-term bearish corrective scenario, the probabilities still favor an upside breakout in the medium-term and beyond.”
“If we do get any more weakness in a scenario like that, then I’ll be accumulating with any remaining capital that I plan on deploying to the uranium sector during that period of time. Conversely, if the sector is lifting off now, then my portfolio has plenty of exposure with 9 U-stocks (enCore Energy, UEC, Energy Fuels, Ur-Energy, Peninsula Energy, Denison Mines, NexGen Energy, Standard Uranium, and Cosa Resources) to ride the bull higher. It is important to get one’s position sizing and cost basis in a stock or sector exposure to the point where you have a strategy in either a breakout or breakdown scenario. I’ll be buying future dips, and hanging on longer to future rips, but eventually selling into them.”
So, I was cognizant of the potential of the uranium miners to keep pulling back down for another month or two at the end of May, but noted that these patterns typically resolve in a bullish manner. Well, we have not been seeing that playing out so far as the consolidation and downward pressure has remained, but that doesn’t mean that we won’t see that upward resolution in the weeks and months to come.
The other point was that my stated strategy was to keep adding to positions during any further pullbacks. My actions have been congruent with my words, because I did add more to uranium positions during the last 2 weeks. I added more Ur-Energy, added more UEC, added more Standard Uranium, added more Cosa Resources, and started a new position Forum Energy Metals (taking me up to a total of 10 uranium stock positions in my resource portfolio).
Was this too early to be wading back into the waters and adding to positions in the uranium stocks? Well, that still remains to be seen, but there are some that would warrant caution based on the bearish tilt to the uranium stocks we just reviewed, and some of the junior explorers just mentioned are even more beat up. Regardless, I’ve added to positions on pullbacks to the 200-day EMA like I mentioned I would do in even earlier uranium articles from this year. Maybe I’m setting myself up for more pain, but I’m using profits pulled from much higher levels to do this new buying.
As a quick refresher for the many new readers here at this channel, that may have missed the updates earlier this year. In late January, after attending an ebullient uranium mixer celebration at the tail-end of the Vancouver Resource Investment Conference (VRIC), I started to trim back some of my uranium positions. Most of the conference had been a bit muted for the gold, silver, base metals companies, so popping into this Uranium Mixer (sponsored by 8 different companies) to close up the conference was the exact opposite experience. Attendees and companies that were crammed into this little pub, holding this uranium mixer, were at a fever-pitch of excitement. I listened to investor after investor pounding their chests on how much they were up on XYZ stock and how they were piling into even more U-stocks, anticipating the sector to just keep climbing and climbing. Look, when everyone is wearing party hats and glad-handing each other giving high-fives and fist bumps, then it’s time to ring the register, and pull some profits off the table.
I ended up trimming back 20-30% of a half-dozen uranium positions in my portfolio after getting home from that event from late January to early February. So here is a good example of making volatility in commodities one’s friend… Uranium Energy Corp (UEC) had been on a blistering run higher in the 2nd half of 2023 and into early 2024, so I sold some on January 25th @ $7.44 and then sold another tranche on February 6th @ $7.74. Then more recently, on June 25th, I bought one of those tranches back at $5.64, knocking essentially $2 off my cost basis, after having locked in gains at higher levels over 5 months ago. Even if I’m a bit early here, or if UEC keeps correcting lower, trimming in Jan/Feb and buying back much lower in late June, was still selling high and buying low.
So we should all consider the times where it is optimum to harvest at least partial gains and trim back big winners; but also look for opportunities to buy right back into corrective moves at a lower cost-basis in that same stock. {obviously there are tax considerations to contend with, and I’m not an accountant or offering any tax advice here, and everyone should talk to an accounting professional for your own unique strategy}. Still, my taxes owed on the longer-term gain, versus the 37% spread between $7.74 and $5.64 pale in comparison, and those gains can be washed out with the inevitable poorly executed losing trades as a US based investor.
Another point to make, is that it is stunning when people research and position in a stock, and then ride it up to a really good valuation; but then don’t take any profits on it, only to watch it sink back down by double digit percentage points. Yes, you need to let your winners run, but come on… you won’t have any winners if you don’t at least take some profits when stocks are up multiple-fold (like most uranium stocks were by late January of this year).
I’m equally confounded when investors do actually take profits on a winning trade, but then don’t buy that stock back when that same good company with the exact same fundamental thesis (that they still liked at much higher levels) goes back on the clearance rack at a huge discount. So in the example above with UEC, if investors liked it in the mid $7s and felt it still had much further to run as this longer-term uranium bull market unfolds, then why wouldn’t it be even more attractive in the mid $5s? Yes, uranium prices have pulled back some since then, but if people believe that spot prices will return to triple-digit levels, or even just hover in the $80s and $90s, then isn’t is reasonable that these companies going into production, developing other mines, and exploring for increased resources will also still have much higher to climb in this cycle?
OK, so we’ve looked at the technical setup in the uranium mining stocks, and noted that many look short-term bearish, and that it is possible the bullish cup & handle pattern on the charts may be failing and breaking down… and that we are at a key inflection point to keep monitoring closely. Longer term, the fundamentals and technicals are still very constructive though.
Now, earlier I mentioned adding to my positions in some uranium exploration stocks, and even adding in a new position, and I did interview 2 of these companies (Cosa Resources and Forum Energy Metals) over at the KE Report recently, that will give readers here more insights into these companies work programs for this year. My thinking is that with so many big multi-fold moves higher having played out in the producers, near-term producers, and developers from 2020 to present, that it is likely time for the explorers to get some of that speculative capital. Exploration stocks can also move up higher even during corrective moves in the underlying commodity, if they make an important discovery. In that sense, explorers and drillplays are less tethered to the commodity price, and more focused on their micro-fundamental company newsflow and catalysts.
Cosa Resources – Summer Exploration Program Updates On 3 Key Uranium Targets In The Athabasca Basin – June 19, 2024
Keith Bodnarchuk, President and CEO of Cosa Resources Corp. (TSX-V: COSA) (OTCQB: COSAF), joins me to review the 3 key targets for this summer work program at this Canadian uranium exploration company operating in the Athabasca Basin region of northern Saskatchewan. The portfolio comprises roughly 209,000 ha across multiple projects in, all of which are underexplored, and the majority reside within or adjacent to established uranium corridors.
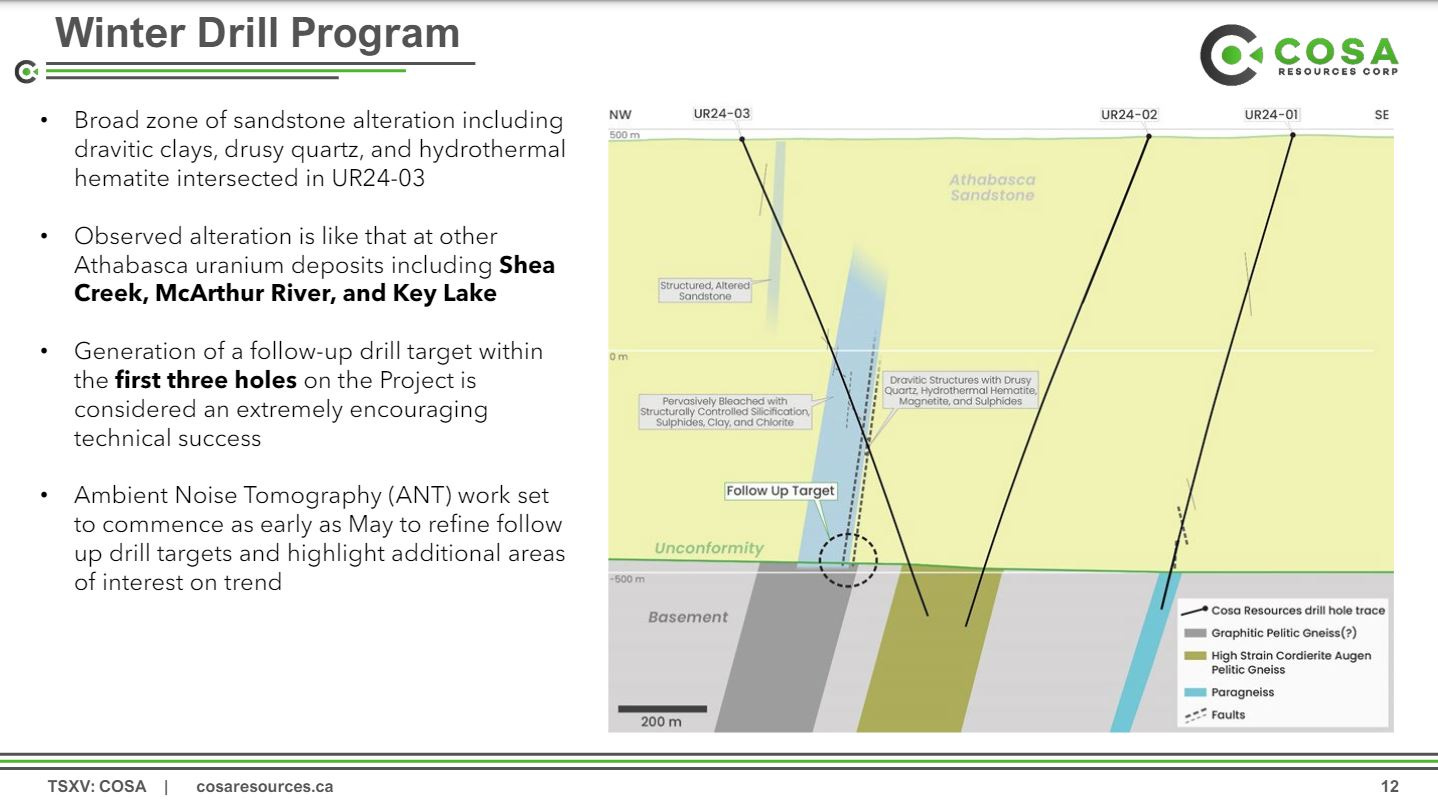
We start of discussing the 2024 drilling will kick off in August at their Ursa Project, following up on Drill hole UR24 -03 from the winter drill program, that intersected structure, alteration, and minor sulphide mineralization several hundred meters above the unconformity.
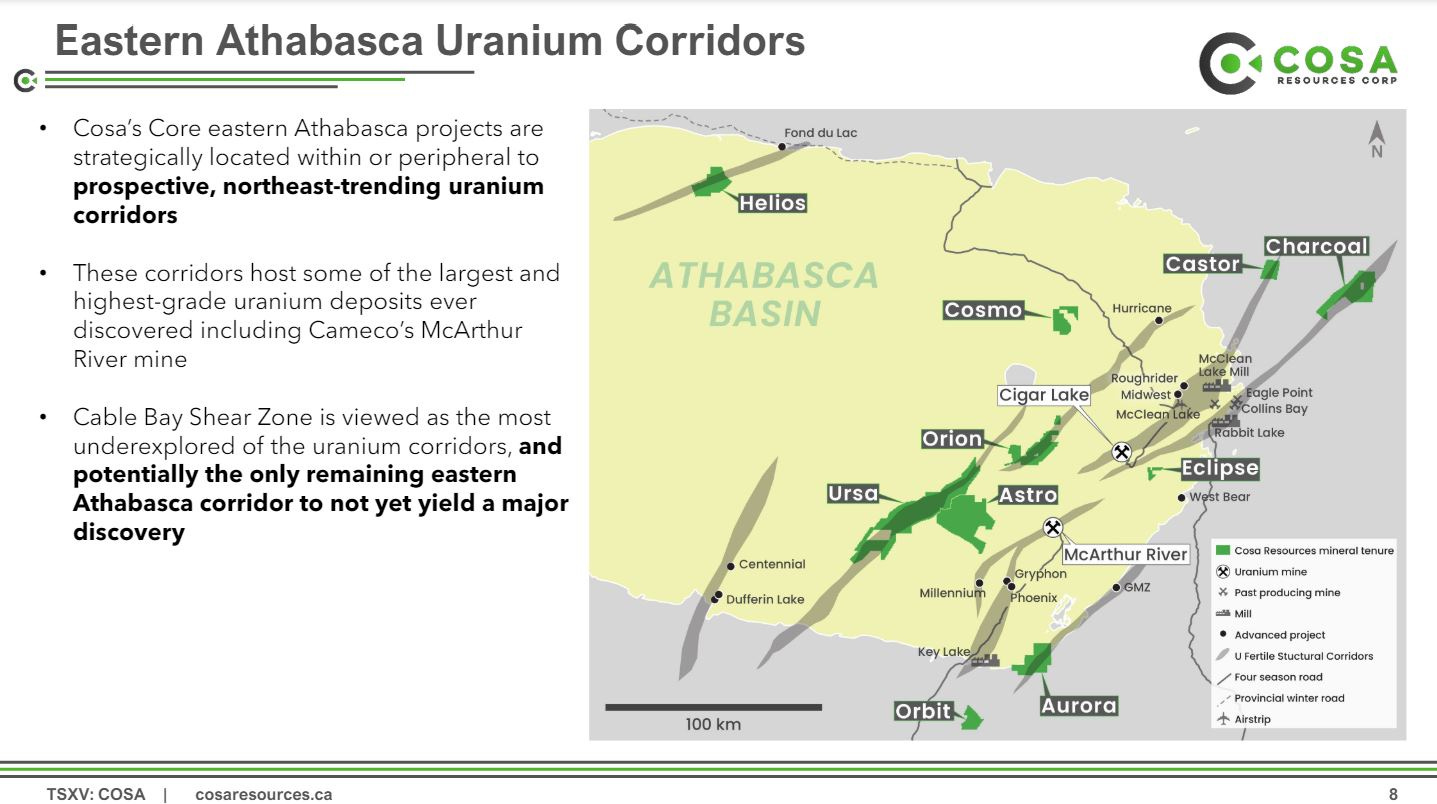
The Ursa Project captures over 60-kilometres of strike length of the Cable Bay Shear Zone, a regional structural corridor with known mineralization and limited historical drilling. It potentially represents the last remaining eastern Athabasca corridor to not yet yield a major discovery. Modern geophysics completed by Cosa in 2023 identified multiple high-priority target areas characterized by conductive basement stratigraphy beneath or adjacent to broad zones of inferred sandstone alteration – a setting that is typical of most eastern Athabasca uranium deposits.
Keith then outlined Cosa’s award-winning management team, which has a long track record of success in Saskatchewan. In 2022, members of the Cosa team were awarded the AME Colin Spence Award for their previous involvement in discovering IsoEnergy’s Hurricane deposit. Prior to Hurricane, Cosa personnel led teams or had integral roles in the discovery of Denison Mines’ Gryphon deposit and 92 Energy’s Gemini Zone, and held key roles in the founding of both NexGen and IsoEnergy.
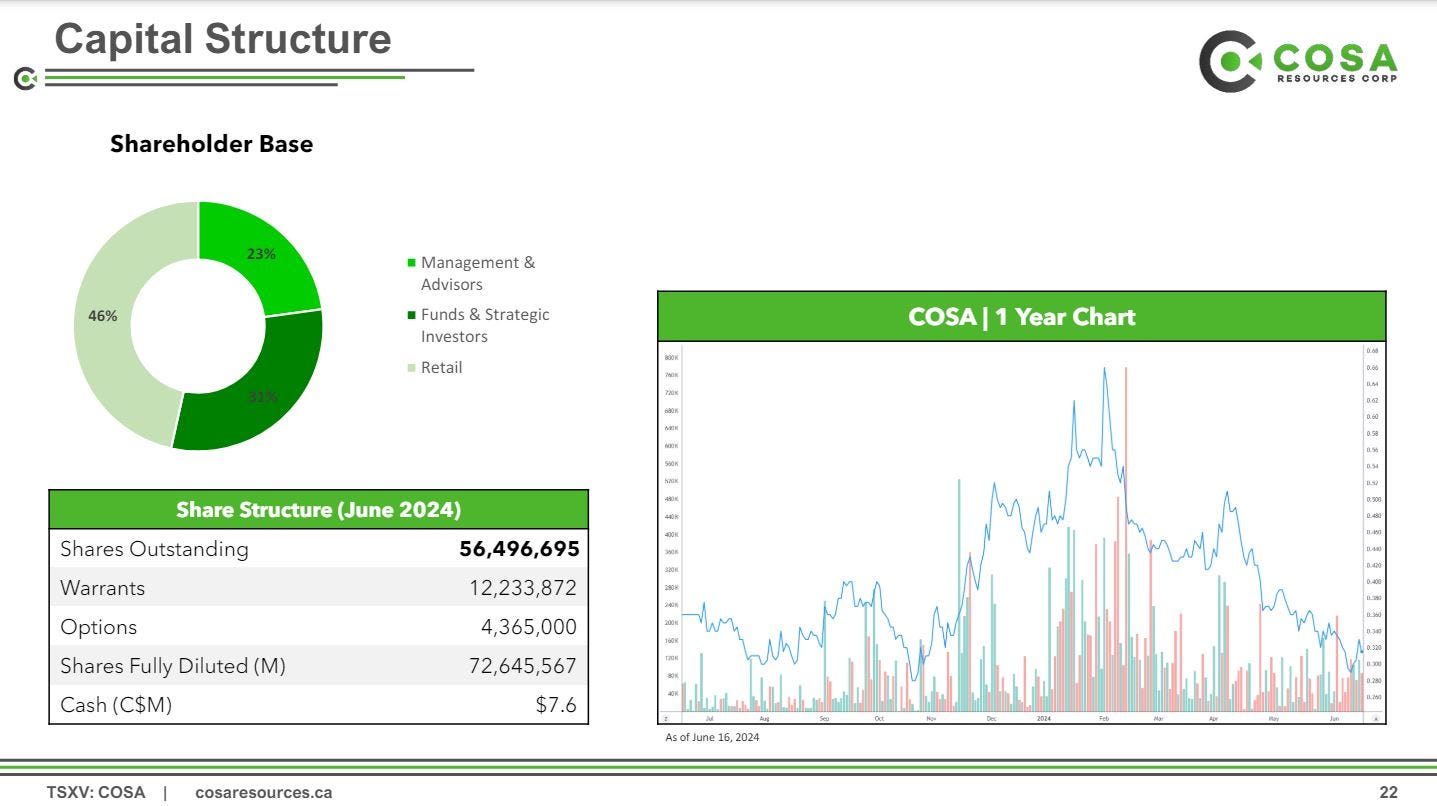
Next we pivoted over to both the Aurora and Orion Projects where the Company will be flying Airborne VTEM gravity at Aurora, and conducting ANT surveying at Orion, to further refine km-scale sandstone conductivity anomalies. Both projects are expected to be drill ready for H1 2025. We wrapped up with the share structure, key strategic investors, and the financial strength of the company to complete this year’s exploration and have access to capital in the future.
Forum Energy Metals - 2 Interviews - Athabasca Basin Projects + 10,000m Drill Program At Aberdeen - June 26, 2024
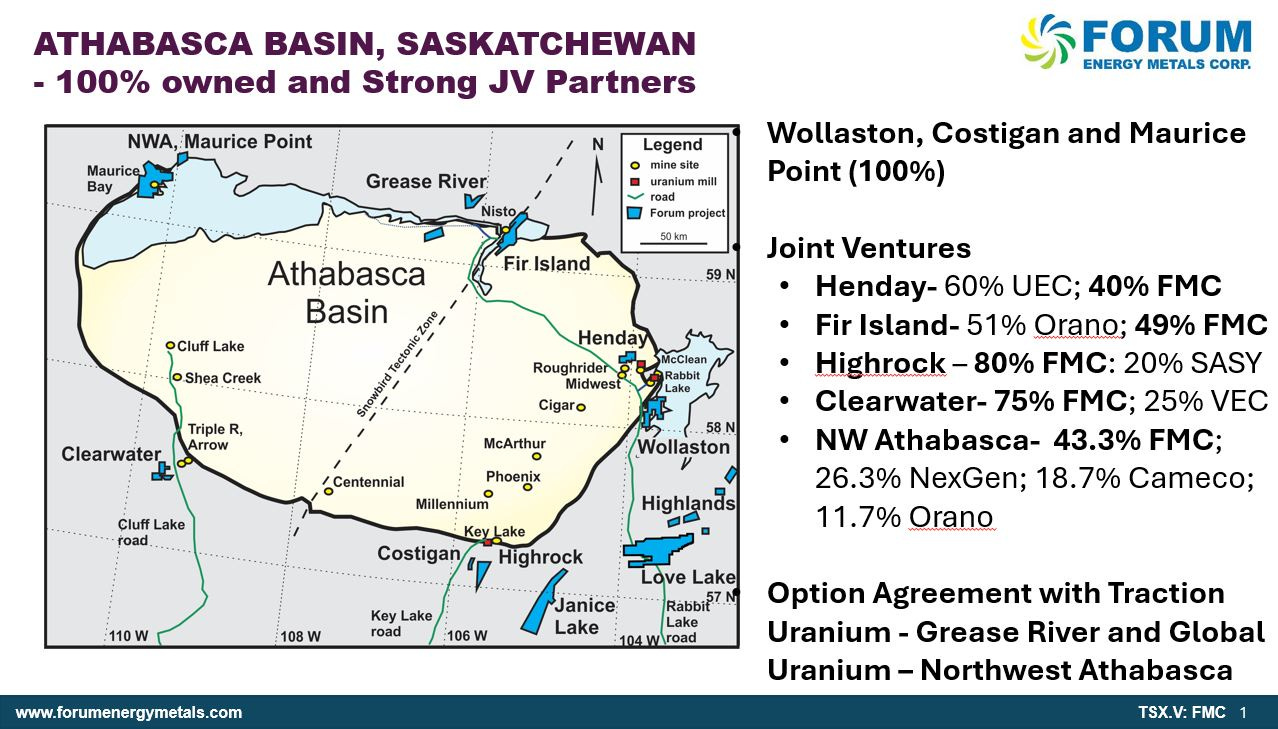
Interview #1: Rick Mazur, President and CEO of Forum Energy Metals (TSX.V:FMC – OTCQB:FDCFF), joins us to provide an update on the Global Uranium option to earn-in to the Northwest Athabasca Joint Venture; partnered with NexGen, Cameco, and Orano in the Athabasca Basin of Saskatchewan. We also dig into the value proposition at the Company’s 8 other uranium exploration projects around the Athabasca Basin.
The Company currently holds a 62.2% beneficial interest in the Forum NexGen JV, which in turns holds a 69.95% beneficial interest in the Northwest Athabasca Joint Venture. Accordingly, the Company holds a 43.32% beneficial interest in the Northwest Athabasca Joint Venture.
Global has an initial right to acquire 51% of the Company’s Interest by:
making staged payments to the Company totalling $225,000 by December 31, 2027;
making staged issuances to the Company of a total of 1,000,000 shares of Global by December 31, 2027; and
making staged payments to the Company equal to the amounts the Company would be entitled to contribute for exploration under the Northwest Athabasca Joint Venture on account of the 2025-2028 operating years totalling a minimum of $3,900,000 and up to a maximum of $9,000,000 to be applied to the corresponding cash calls, depending on the participation of the minority partners in the Northwest Athabasca Joint Venture in any approved exploration program.
Forum will remain Operator of the Northwest Athabasca Joint Venture during the Initial Option period.
In addition to the work that will be going on at this project, we zoom out and give Rick the opportunity to unpack the opportunities and other JVs going on with a number of their other 8 projects around the Athabasca Basin. He highlights their 100% owned Wollaston Project, Costigan, and Maurice projects, and also a number of their JV projects like the Grease River, Fir Island Project, Highrock, Clearwater, and Henday Projects.
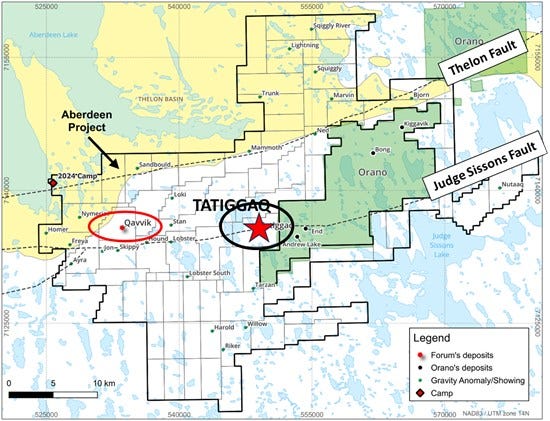
Interview #2: Rebecca Hunter, VP of Exploration at Forum Energy Metals (TSX.V:FMC – OTCQB:FDCFF), joins me to review the news released on June 25th announcing the 10,000 meter diamond drilling program at their 100% owned Aberdeen Uranium Project, in the Thelon Basin, Nunavut. Forum plans on drilling approximately 8,000 meters in about 25-30 drill holes, largely within the Tatiggaq anomaly, as well as drilling approximately 2,000 meters and 10 drill holes on other highly prospective regional areas, like the Ned, Bjorn, and Qavvik targets.
We discuss what was learned in last year’s more limited drill program, after their uranium discovery reported on hole TAT23-002 that intersected 2.25% U3O8 over 11.1 m (from 148.5 – 159.6 m). One of the key takeaways was getting the angle of drilling more properly aligned compared to what historic operators had tried, and this is what allowed for the new discovery and also will be instructive for the much larger drill program this year exploring Tatiggaq.
Rebecca also reviewed that the company is utilizing the data modeled from last year’s Ambient Noise Tomography (ANT) survey, to refine and outline high-priority drill targets as they move away from the known mineralization at Tatiggaq West and Main. Additionally, the processed ANT data on Ned has outlined the unconformity depth (Thelon Formation sandstone) as well as potential faults and alteration that will be targeted in the upcoming drilling program. She also shares why she’s excited to drill Bjorn, Qavvik, and that there are even other targets to still get to in follow up drill programs.
In addition to the uranium exploration company interviews, we had 2 more interviews over at the KE Report last week that got into the energy sector and uranium stocks with both Sean Brodrick and Fabi Lara, that I want to include for readers here to review, as there are some cogent points made by both of them.
Sean Brodrick – Investing Opportunities In Energy Sector With Oil, Nat Gas, And Uranium Stocks – June 25, 2024
Fabi Lara – A Bullish Fundamental Uranium Sector Does Not Mean A Bullish Individual Uranium Stock - Jun 27, 2024
In addition to our interviews at the KE Report, I felt there were 2 other really solid interviews in the sector recently worth including in this article for more of the fundamental side of the nuclear fuels and uranium side of the industry from Mike Alkin and Justin Huhn (2 of the better informed individuals discussing this sector).
Mike Alkin - Uranium Market Insights, Inventories, Delays, Q&A w/ Triangle Investor - Jul 1, 2024
Justin Huhn - Uranium Insider - Latest Uranium News (w/ Jimmy Connor)
Thanks for reading and may you have prosperity in your trading and in life!
- Shad