

Gold And Gold Stocks Update – Are You Fired Up Or Is Your Wood Wet?
Gold And Gold Stocks Update – Are You Fired Up Or Is Your Wood Wet?
Excelsior Prosperity w/ Shad Marquitz (09/17/2024)

The first 2 days of this 3rd week of September have been a wild ride in the yellow metal; with gold futures popping up to new all-time highs of $2,617.40 during Monday’s trading, and then reversing down sharply on Tuesday into the $2,590s for most of the day. This selling pressure we saw today in the markets is likely short-term uncertainty and posturing in front of the Fed’s first rate cut tomorrow. Some analysts believe that if the Fed only announces a 25 basis-point hike, versus the anticipated 50 basis-point hike, that gold may get hit a bit in the short-term. We’ll see but this is likely just short-term noise.

While these brief blips on the chart are interesting, they aren’t germane for the larger trend that has been solidly in place for some time. Keep in mind that gold just closed last week on Friday above $2,610, which was the highest daily and weekly close on record, after a relentless run higher for the last 2 years off it’s November 2022 low of $1618.30. As of yesterday at $2,617.40, Gold has tacked on about $1,000 dollars since it’s low from 2 years back. That is what is important - the trend.
Even yesterday, on Monday September 16th gold still put in a close near that level at $2,608.90, which was slightly down, but still seeing gold with a $2,600 handle. Now, yes, today that round level broke, with a close down to $2,592.40, but gold is still way up in pricing and still very close to it’s all-time highs from just 1 day ago. The RSI at 63.50 is getting higher, but cooled off a bit today, but is still not overbought on the daily chart. Could we drop down to the 50-day EMA. Sure…
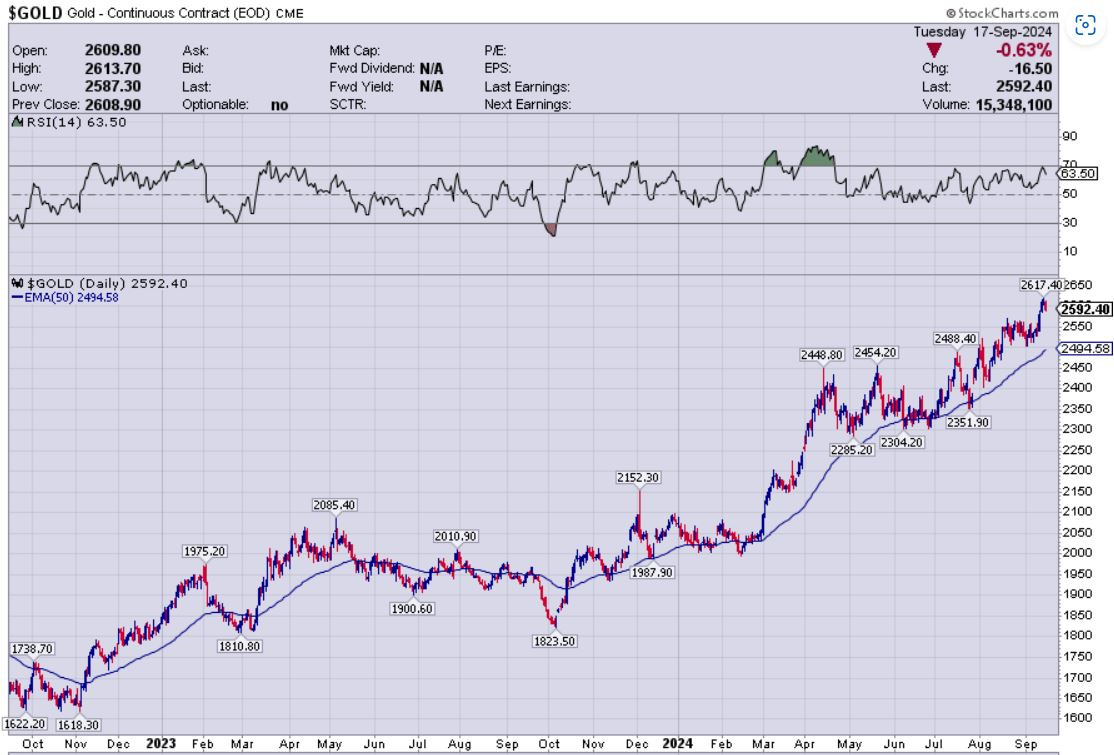
We should point out how bull markets like to climb a wall of worry. The whole way higher in gold, since making new all-time highs in November of last year and again in December, there has been a big contingency of traders doubting this move. Once clearing the $2100 level to $2,200, then $2,300, then, $2,400, then $2,500, and more recently $2,600; there have been technicians and analysts calling for a retest of the $2,150 or $2,080 areas, that never came to pass. Instead, gold just kept plowing higher and higher, occasionally back-testing the 50-day Exponential Moving Average (EMA), and it’s been up 6 out of the last 7 months, and been making repeated new daily and weekly highs most of this year. That’s bull market action.
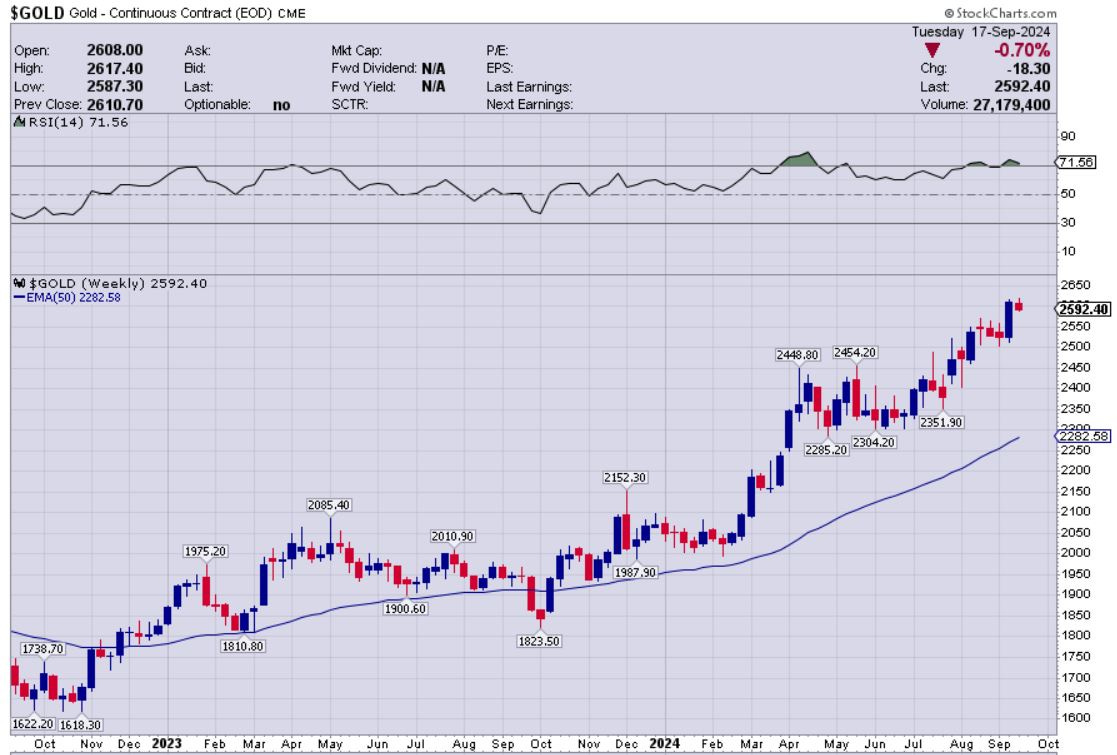
Gold has been getting mildly overbought lately on the weekly chart below, but the RSI is currently at 71.56, so just barely overbought. In a bull market, things can stay overbought for longer than seems rational. However, one area of caution on the weekly chart is just how far pricing is above the 50-week EMA (currently at $2,282.58). This EMA is sloping higher and will continue moving higher based on the price action the last month and half, but it would not be a surprise to pricing drop to retest that rising 50-week EMA at one point in the next couple of months. Nothing moves up in a straight line…
As far as the fundamental drivers, gold is a dynamic global market, and there are many factors at play beyond just what happens to US monetary policy. Sometimes US commentators get a bit too myopic. There has been a steady stream of global central bank buying, along with substantial investor buying out of the East, underpinning those consistently higher prices in this monetary metal on the way up. Additionally, there has been ongoing geopolitical concerns around the globe from South American elections, to political unrest in many spots of Africa, and especially the ongoing conflicts with Russia and Ukraine, and the Israel/Hamas flare ups. Of course, there is also a considerable amount of political uncertainty around the upcoming US elections, and what it may mean for global trade, US economic health, and the general stock markets after the results roll in.
While so much focus is on gold priced in US dollars, it should also be pointed out that gold has been making highs in almost every currency on the planet. This just demonstrates the erosion of fiat currencies purchasing power, as they continue to diminish when priced in gold. If it takes more fiat currency to purchase an ounce of gold, then gold’s appreciation points to fiat’s depreciation. This is the way it has always been, and highlights gold’s role as a store of value over time.
As a reminder, when the dollar was unpegged from gold in 1971 it took 35 greenbacks to buy one ounce of gold. Now it takes roughly 2,600 greenbacks. Gold didn’t change – it’s on the elemental table. What changed was the purchasing power of a dollar. This highlights the insidious tax of inflation over time, and the result of reckless government fiscal spending, along with excessive money creation and expansion of the money supply from central banks.
Speaking of poor policies from central banks… Yes, we can also add to that list of value drivers that there has been a constant run-up with gold futures prices in advance of the “Powell Pivot.” We’ve endured almost 2 years of market pundits pontificating about when the central bank would reverse course on monetary tightening and switch their playbook back to monetary loosening. Well, the Fed is finally going to be starting their rate cutting cycle this week at the September 18th FOMC meeting tomorrow. There should be some volatility the balance of this week.
When one pans back to the longer-term setup, many analysts agree that the rate cutting cycle should be generally bullish for gold over time. In general, as interest rates pull back lower, then there is less carrying cost for gold, which doesn’t pay yields, and less of a delta between assets like treasury notes that do pay yields.
What was really interesting the last couple years is that interest rates got up above 5% and yet gold prices still went up in tandem, causing many mainstream financial outlets to scratch their heads in confusion. This just points again to gold being a global asset, and there is much more to it than what happens in the US fiscal or monetary departments. Global central banks and eastern buyers were buying the safe-haven instrument as portfolio diversifiers, with little thought to US treasury yields. It’s a big world out there, but the US is still the world’s largest economy, so it has an outsized influence on many markets.
Reflecting back over the last couple years, from the very first rate hike in early 2022, many people just knew it was just a matter of time before the Fed would reverse course and start cutting rates once again. Clearly we should remember what actually happened though – the monetary tightening went on for far longer and went far higher than almost anyone thought was possible.
Remember all those pundits that were just positive it was going to be a “one and done” rate hike back in 2022? (Yeah… no…)
To their defense though, remember when Powell and other Fed heads stated back in late 2021 and early 2022 that they weren’t even thinking of thinking about hiking rates until 2023, because inflation was transitory? (Yeah… no….)
There was nobody in early 2022 (including members of the Fed) calling for a 5.25% Fed Funds Rate… but that is where it is and has been for some time now. That’s quite a disconnect from the 10-year and 2-year treasury yields. Wild times…
Remember all those stats about the Fed switching from hiking rates back to cutting rates on average 60-90 days after stopping the hiking cycle? Yeah…. well that sure didn’t happen. I guess this time really was different….
So, we are really in a new paradigm. We’ve never seen anything like what we just saw the last 4 years coming out of the pandemic lockdowns, with massive amounts of fiscal spending backstopped by central banks that fueled a reflation trade, and in tandem spiked the inflation punchbowl. We were told that inflation was just going to be transitory due to supply chain issues for a month or two, and that the Fed wasn’t planning on accelerating it’s tapering of QE (which they claimed wasn’t QE). After acknowledging that was incorrect and inflation was stickier and that they would have to accelerate the tapering of their bond buying, it was followed by the most extreme rate hiking cycle ever (in percentage terms). This was then followed by one of longest pauses of rates at such high rates (compared to where they were the prior decade). It’s no wonder that the vast majority of talking heads on mainstream financial outlets have been wrong about everything the whole way along.
Now, everyone is finally on the same page going into tomorrow’s Federal Open Market Committee meeting, where it is anticipated that Powell will pivot and begin cutting the Fed Funds rate, and kick off a new rate cutting cycle.
The question at this point remains: Has this rate cutting cycle already been fully priced in by the markets?
We are told every day that the markets are forward-looking and discount the future 3-6 months in advance. Well, with everyone and their grandmothers having priced in a series of rate cuts since the end of last year, and with interest rates having already dropped down into the mid 3%’s, and the yield curve un-inverting and re-steepening on the long end, then has it already been fully factored in?
There is room for debate here, with some analysts thinking it is all priced in, and others pounding the table that it is nowhere close to priced. Again, if we look at past loosening cycles, rate cuts have actually been net bearish for general markets, and conversely net bullish for both gold and the gold stocks. Will this time be different?
Just today, my friend and colleague, Jordan Roy-Byrne, over at The Daily Gold, put out some statistics in an email to subscribers, highlighting how gold stocks have moved after prior periods where the Fed starts cutting rates.
“Gold Stocks made big moves almost immediately after Fed started cutting rates in last 4 rate cut cycles.”
“2019: +18% move in 1 month, (+35% 2 months prior - 2019 saw very strong performance right before the rate cut because the Fed shocked market two months before, indicating it would cut.)”
“2007: +52% move in 2.5 months, +72% in 5 months”
“2001: +41% move in 2 months, +87% in 4.5 months”
“1989: +51% move in 9 months”
So, this begs the question: Are we going to see another 35%, 41%, or 52% move in gold in the next few months?
Or…. Has the big move up in gold we’ve already seen the last couple of years, and especially the last couple of months, already priced in this rate cutting cycle? Will this end up being more of a “buy the rumor, sell the news” type of market discounting? We’ll all know soon enough how this all plays out.
Here’s the truth. Nobody knows…. What we can say is that the gold chart has been very bullish for some time now, and while the quality gold stocks have responded by moving higher, the GDX is still nowhere close to all-time highs, and hasn’t even pierced it’s 2022 or 2020 highs yet. We have not seen the type of leveraged moves higher in the gold equities that most investors or sector pundits expected to see at $2,100 gold, or $2,200 gold, or $2,300 gold, or $2,400 gold, or $2,500 gold, or $2,600 gold. So is the thesis wrong? Is this time different?
I’m of the disposition that the gold stocks still have a lot of catching up to do in valuation, regardless of whether gold ramps up another 30-50% or if it just trends sideways. For goodness sakes, GDX just closed today at $39.49, below it’s 2022 peak of $41.60, or it’s 2020 peak of $45.78, when gold prices were $600 less, and when margins were considerably less. Again, GDX is nowhere close to it’s all-time high of $66.98 from back in 2011 when margins were much less. That is a massive disconnect, and it will get balanced out.

We’ve gone over this before, but it is worth restating. This also has nothing to do with shrinking margins either. I continue to hear sector pundits waive away this glaring disconnect by parroting back what other sector pundits have been mindlessly echoing that rising costs is the sole explanation. That’s just simply not true. If it was truly about margins, then we’d see GDX, chock full of the major and mid-tier gold producers, at all-time highs right now; because right now is the highest margins we’ve ever seen in this sector.
For some frame of reference on how costs have effected margins: Gold producer margins in 2010 averaged $480 per ounce, and in 2011 (the all-time high in GDX) they averaged around $640-$660. In 2020, gold producer margins spiked to their highest levels prior to now at around $800, but the GDX only got to $45.78. If it was only about margins and costs, then in 2020 GDX should have eclipsed the 2011 high of $66.98, but yet it got nowhere close.
Now look at the setup we’ve had recently. All-In Sustaining Costs (AISC) for the major and mid-tier producers are around $1500-$1600 per ounce, and yet the metals prices have been in the $2,500-$2,600 per ounce range. That is a $900-$1000 spread, and clearly the highest margins we’ve ever seen in the sector! There are also a lot of producers that have an even lower AISC than $1500 or $1600. Many producers still have an AISC in the $1000-$1300 level. Or think about Sandstorm Gold (yes, the royalty company) that has over $2,000 margins in today’s metals price environment. You wouldn’t know it by it’s chart.
So where are all the people banging on the drum about “margin expansion?” Why haven’t the “forward-looking markets” moved the GDX up above $70 or $80 now? (Here’s a clue… because it isn’t about margins…. and it isn’t about dilution…. It’s about sour investor sentiment and a lack of momentum).
Eventually more analysts will wake up to the margin expansion and start to realize that making $900, $1,000, $1,200, $1,500, or $2,000 (depending on the company) profit on each gold ounce produced will translate over into these gold producers and royalty/streaming companies literally printing money. Will it be in Q3?
Let’s look at a few examples for where these gold stocks are starting to get traction. Unfortunately for the GDX it is heavily weighted to Newmont (at 15% of that index with an All-In Sustaining Cost of $1562 in Q2) and Barrick at (8.82% of the index with an All-In Sustaining Cost of $1,498 in Q2). Investors love to view the whole sector through the lens of those 2 mining behemoths, but really they are not the best run or lowest cost operators by a landslide.
The best run major, which has now moved into the #2 spot for size is actually Agnico Eagle, with all-in sustaining costs ("AISC") per ounce of $1,169 ($300-$400 less than Newmont and Barrick), and all around better projects and management and operations execution. Why not weight Agnico in the GDX at the 15% level, and then bump down Newmont and Barrick to 6%-7% and punish them for their sector underperformance? The market sure is punishing them, so why not rebalance the GDX accordingly? Bigger isn’t always better…

I’ve stated for the last few years, and in a number of prior articles on this Substack channel; Alamos Gold (AGI) is really the king of the mid-tier gold producers. Their AISC in Q2 was $1,096, and for the first 6 months averaged $1,178. If they keep lowering costs for the balance of the year, now that they have Magino coming in the fold, from their takeover of Argonaut Gold, then let’s say they average around $1,100 AISC for the year. At $2,600 gold that is a $1,500 margin! For goodness sakes, that is a huge margin, and likely the largest they have ever seen as company. People need to stop it with the “rising costs” explanation.

At least the Alamos stock chart reflects that, but it is insane that they are only weighted in the GDX at 2.43%. Why not weight that outperformance with a 5%-8% ETF allocation?
Are you starting to see how you can outperform the GDX by constructing your own portfolio of better run or higher-torque companies? #BuildYourOwnETF
Yes, I realize there is more to fundamental analysis than just looking at All-In Sustaining Costs, or margins, as there are things like debt levels, mineral reserves, mineral resources, sustaining capital, dividends, etc… to take into account.
However, when people have been making silly blanket statements like “The stocks aren’t performing as well as the metals due to rising costs and their shrinking margins,” then it just seemed worth diving into the topic again a bit further and setting the record straight.
We keep hearing about these $1,500-$1,600 average AISC from the gold producers, but there are a number of small to mid-size gold producers that have much better All-In Sustaining Costs than many of the big boys. Because they are smaller or in perceived risky jurisdictions, then they are just not getting the attention of investors and analysts yet, but this won’t be the case forever. If you are making money and paying down debt, then eventually that will get noticed.
Over at the KE Report, we interview producing gold companies like Mako Mining Corp. (TSX-V:MKO)(OTCQX:MAKOF) with an AISC in Q2 of $1,098, or Thor Explorations Ltd. (TSX.V / AIM: THX) (OTC: THXPF), with an AISC in Q2 of $802 per ounce. Again, those are really fat margins at $2,500 - $2,600 gold coming up for Q3 earnings, and hardly anyone has noticed the progress the smaller producers are making in this kind of a gold price environment.
Mako Mining – Q2 Financials Review At The San Albino Mine, Exploration Update At Las Conchitas And Regional Targets, And The Key Work Initiatives At The Eagle Mountain Gold Project
Thor Explorations – Record Amount Of Gold Poured In Q2 – Recap Of Quarterly and H1 Financials At Segilola Mine, Exploration Updates From The Douta Project
The last thing worth noting is what the $2,500-$2,600 gold price is doing to the economic sensitivities on development stage projects. I understand that the largest companies want to be ultra-conservative, but is using $1,250-$1,400 gold assumptions on projects really the best idea at current gold prices that are more than a thousand dollars higher than that? Even $1,500-$1,700 gold price models need to be thrown out. We are at and have been at gold prices north of $2,400 for the last 5 months, and often $100-$200 more than that. When the will the industry at least jump up the gold assumptions in economic studies to $2,000? What will it take - $2,700 gold? $3,000 gold? Gold isn’t going back to $1500 for a long time.
Many companies I met with at the Beaver Creek conference have wisely started including metals sensitivities tables showing a base case at $1,800 or $1,900 gold, but then also spot prices at $2,500 gold and/or $30 silver. If the markets really are forward looking, then they probably should be looking at prices even higher than that, but at least for comparative purposes on Net Present Value (NPV), Internal Rates of Return (IRR), and Payback Periods, let’s run them all at $2,500 gold and $30 silver and see where the chips fall… otherwise many of these studies are apples and oranges comparisons on the those metrics based on where the metals assumptions were at the time of the study.
Yes, I realize that at current metals prices almost every project simply sings with solid economics… but that is kinda the point about the current disconnect in gold stock valuations…. We are in an environment where these development projects should be surging higher, and yet, they remain muted to down near their lows. I understood the skepticism when gold was repeatedly trying to break above $2,000 and then $2,100; but we are well beyond those levels now.
These kind of valuation disconnects cannot sustain for much longer, and thus there is a huge opportunity hiding in plain sight with the gold developers. If these economic studies are somewhat recent and properly factor in the increased inflation into their capex costs, then it makes sense to run them all at current metals prices and see how they start to stack up against one another. Current valuations are wack!
It is very possible that we could see many of them start gapping higher, just like we did in half dozen of the better projects when Osisko Mining Inc. (TSX:OSK) (OTC: OBNNF) announced it was being acquired by Gold Fields Limited (NYSE: GFI) for a 55% premium. People saw where ounces in the ground were valued.
We’ll continue to analyze more opportunities like that in our series on opportunities in gold explorers and developers and the other series on mergers and acquisitions. We’ll also do the same thing in the silver and copper stocks in future articles, so stay tuned for more tantalizing trade ideas and value arbitrage setups as we continue to trudge our way through this bull market.
Thanks for reading and may you have prosperity in your trading and in life!
Shad